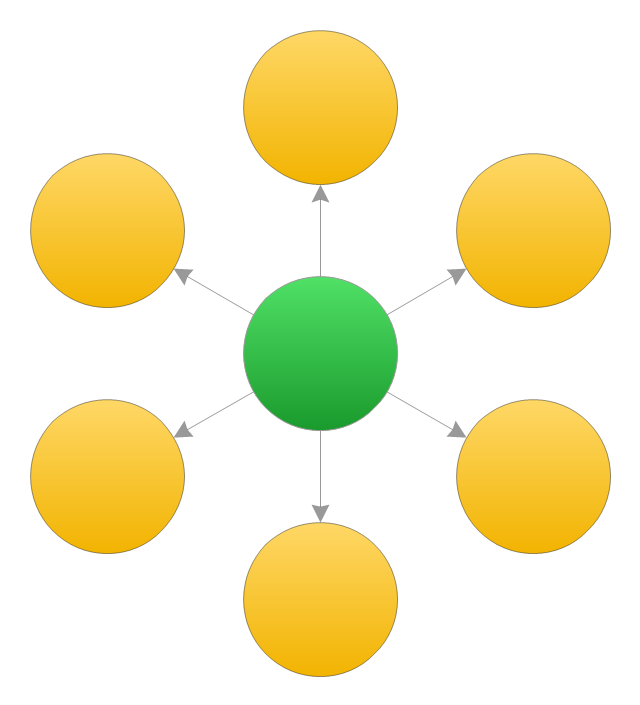
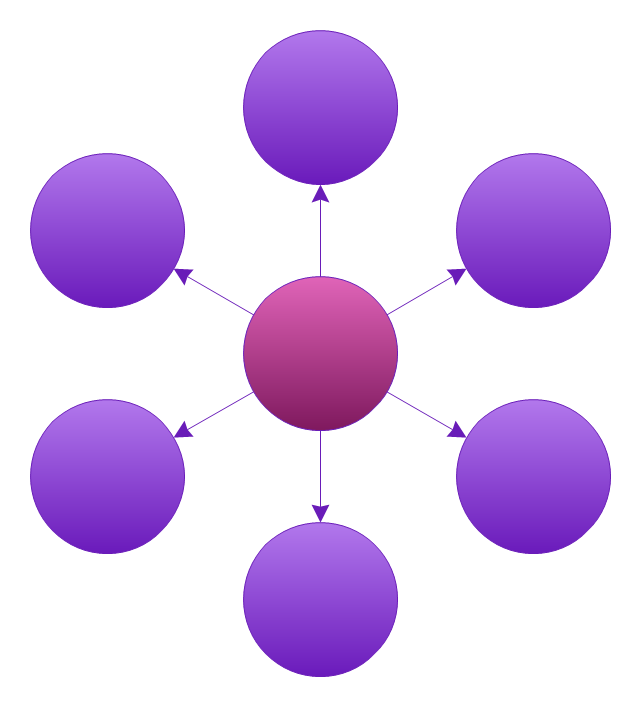
This circle-spoke diagram sample shows the social determinants of health. It was created on the base of the hub-and-spoke diagram from the Health Canada website. [hc-sc.gc.ca/ sr-sr/ pubs/ hpr-rpms/ bull/ 2005-climat/ 2005-climat-6-eng.php]
"Social determinants of health are the economic and social conditions – and their distribution among the population – that influence individual and group differences in health status. They are risk factors found in one's living and working conditions (such as the distribution of income, wealth, influence, and power), rather than individual factors (such as behavioural risk factors or genetics) that influence the risk for a disease, or vulnerability to disease or injury. According to some viewpoints, these distributions of social determinants are shaped by public policies that reflect the influence of prevailing political ideologies of those governing a jurisdiction. ...
In 2003, the World Health Organization (WHO) Europe suggested that the social determinants of health included:
(1) Social gradients (life expectancy is shorter and disease is more common further down the social ladder).
(2) Stress (including stress in the workplace).
(3) Early childhood development.
(4) Social exclusion.
(5) Unemployment.
(6) Social support networks.
(7) Addiction.
(8) Availability of healthy food.
(9) Availability of healthy transportation." [Social determinants of health. Wikipedia]
The hub-and-spoke diagram example "Social determinants of health" was created using the ConceptDraw PRO diagramming and vector drawing software extended with the Circle-Spoke Diagrams solution from the area "What is a Diagram" of ConceptDraw Solution Park.
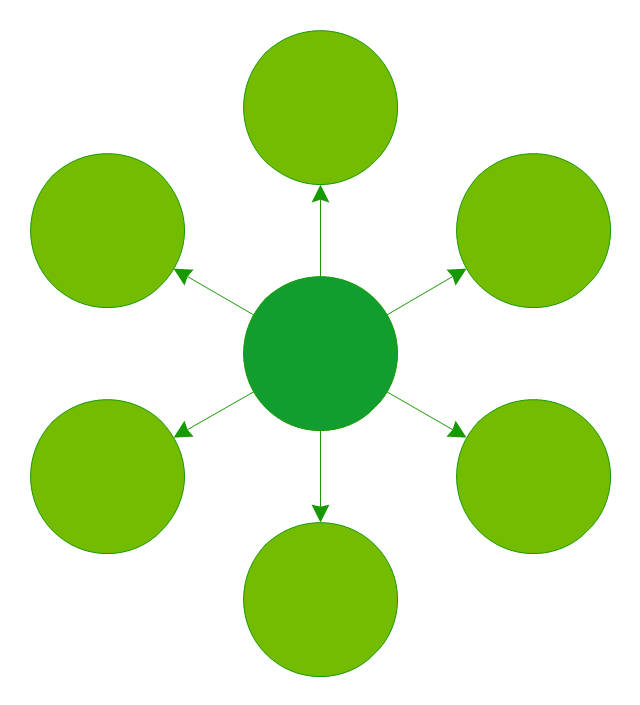
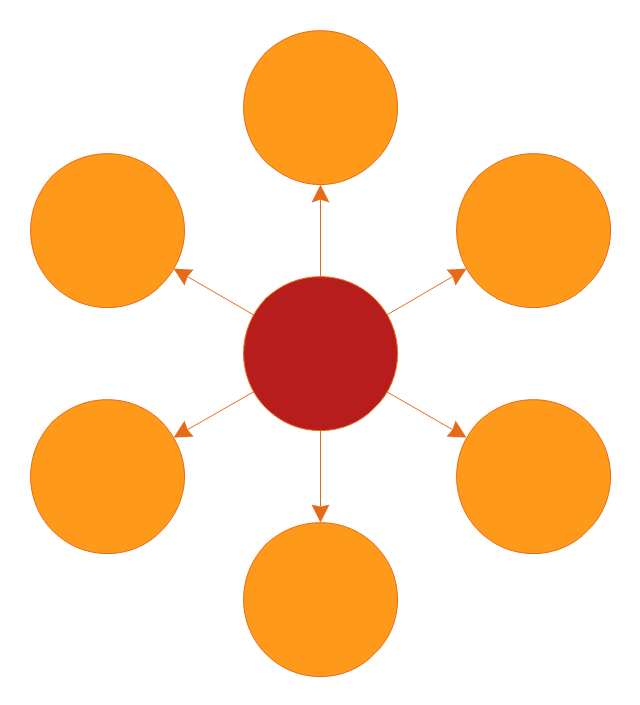
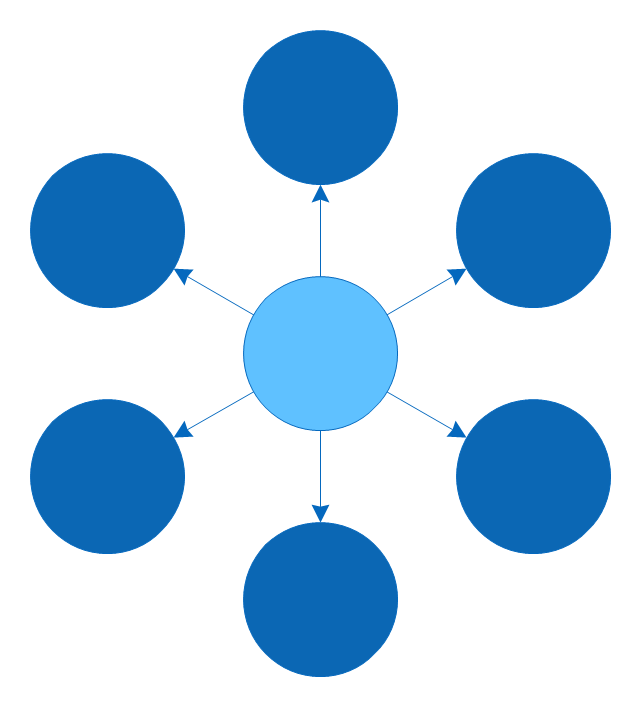
Circle-spoke diagram

The vector stencils library "Circle-spoke diagram" contains 8 templates of circle-spoke diagrams.
Use these shapes to draw your circle spoke diagrams in the ConceptDraw PRO diagramming and vector drawing software extended with the Circle-Spoke Diagrams solution from the area "What is a Diagram" of ConceptDraw Solution Park.
Use these shapes to draw your circle spoke diagrams in the ConceptDraw PRO diagramming and vector drawing software extended with the Circle-Spoke Diagrams solution from the area "What is a Diagram" of ConceptDraw Solution Park.
Circle-Spoke Diagram 1
Circle-Spoke Diagram 2
Circle-Spoke Diagram 3
Circle-spoke diagram 4
Circle-Spoke Diagram 5
Circle-Spoke Diagram 6
Circle-Spoke Diagram 7
Circle-Spoke Diagram 8
 Basic Area Charts
This solution extends the capabilities of ConceptDraw DIAGRAM (or later) with templates, samples and a library of vector stencils for drawing Area Charts (area graphs) that visualize changes in values by filling in the area beneath the line connecting data points.
 Stakeholder Onion Diagrams
The Stakeholder Onion Diagram is often used as a way to view the relationships of stakeholders to a project goal. A basic Onion Diagram contains a rich information. It shows significance of stakeholders that will have has influence to the success achieve
Process Flow Chart

Star Network Topology


- Cause And Effect Diagram For Stress
- Social determinants of health | Circle Diagrams | Circle- Spoke ...
- Circle- Spoke Diagrams | Social determinants of health | What Is a ...
- Circle Spoke Diagram Template | Social determinants of health ...
- Social determinants of health | Process Flowchart | Venn Diagram ...
- Circle- Spoke Diagrams
- Circle- Spoke Diagrams | Social determinants of health | How To ...
- Social Determinents Of Health Diagram
- Social Ecological Model (SEM) - Onion diagram | Social ...
- Health Diagrams
- World Health Organisation Diagram
- Social determinants of health | Types of Flowcharts | Onion Diagram ...
- Social Model Diagram Circle 1 6
- Social determinants of health | UML Use Case Diagram Example ...
- What Is a Circle Spoke Diagram
- Health Food | Social determinants of health | Health endpoint ...
- Block diagram - Types of individual behavior in organization | Social ...
- Diagrams On Health
- Relations diagram - Health care | Social determinants of health ...
- Object-Oriented Design | Basic Area Charts | Star Network Topology ...