 Biology
Biology solution extends ConceptDraw DIAGRAM software with samples, templates and libraries containing biological vector symbols, to help you create scientific and educational designs in the field of biology.
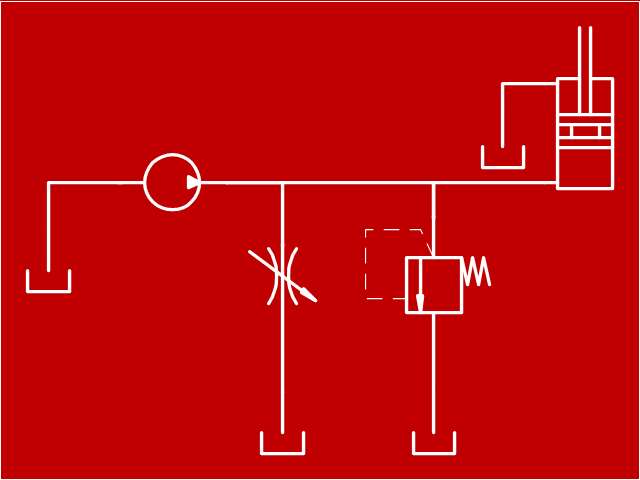
"Hydraulics is a topic in applied science and engineering dealing with the mechanical properties of liquids. At a very basic level hydraulics is the liquid version of pneumatics. Fluid mechanics provides the theoretical foundation for hydraulics, which focuses on the engineering uses of fluid properties. In fluid power, hydraulics is used for the generation, control, and transmission of power by the use of pressurized liquids. Hydraulic topics range through some part of science and most of engineering modules, and cover concepts such as pipe flow, dam design, fluidics and fluid control circuitry, pumps, turbines, hydropower, computational fluid dynamics, flow measurement, river channel behavior and erosion." [Hydraulics. Wikipedia]
This hydraulic schematic example was redrawn using ConceptDraw PRO diagramming and vector drawing software from the Wikimedia Commons file: Skjematikk.GIF.
[commons.wikimedia.org/ wiki/ File:Skjematikk.GIF]
This file is licensed under the Creative Commons Attribution-Share Alike 3.0 Unported license.
[creativecommons.org/ licenses/ by-sa/ 3.0/ deed.en]
The engineering drawing example "Hydraulic schematic" was created using the ConceptDraw PRO diagramming and vector drawing software extended with the Mechanical Engineering solution from the Engineering area of ConceptDraw Solution Park.
Hydraulic schematic example
Metropolitan area networks (MAN). Computer and Network Examples
. Computer and Network Examples")

Design Pictorial Infographics. Design Infographics

Total Quality Management Definition

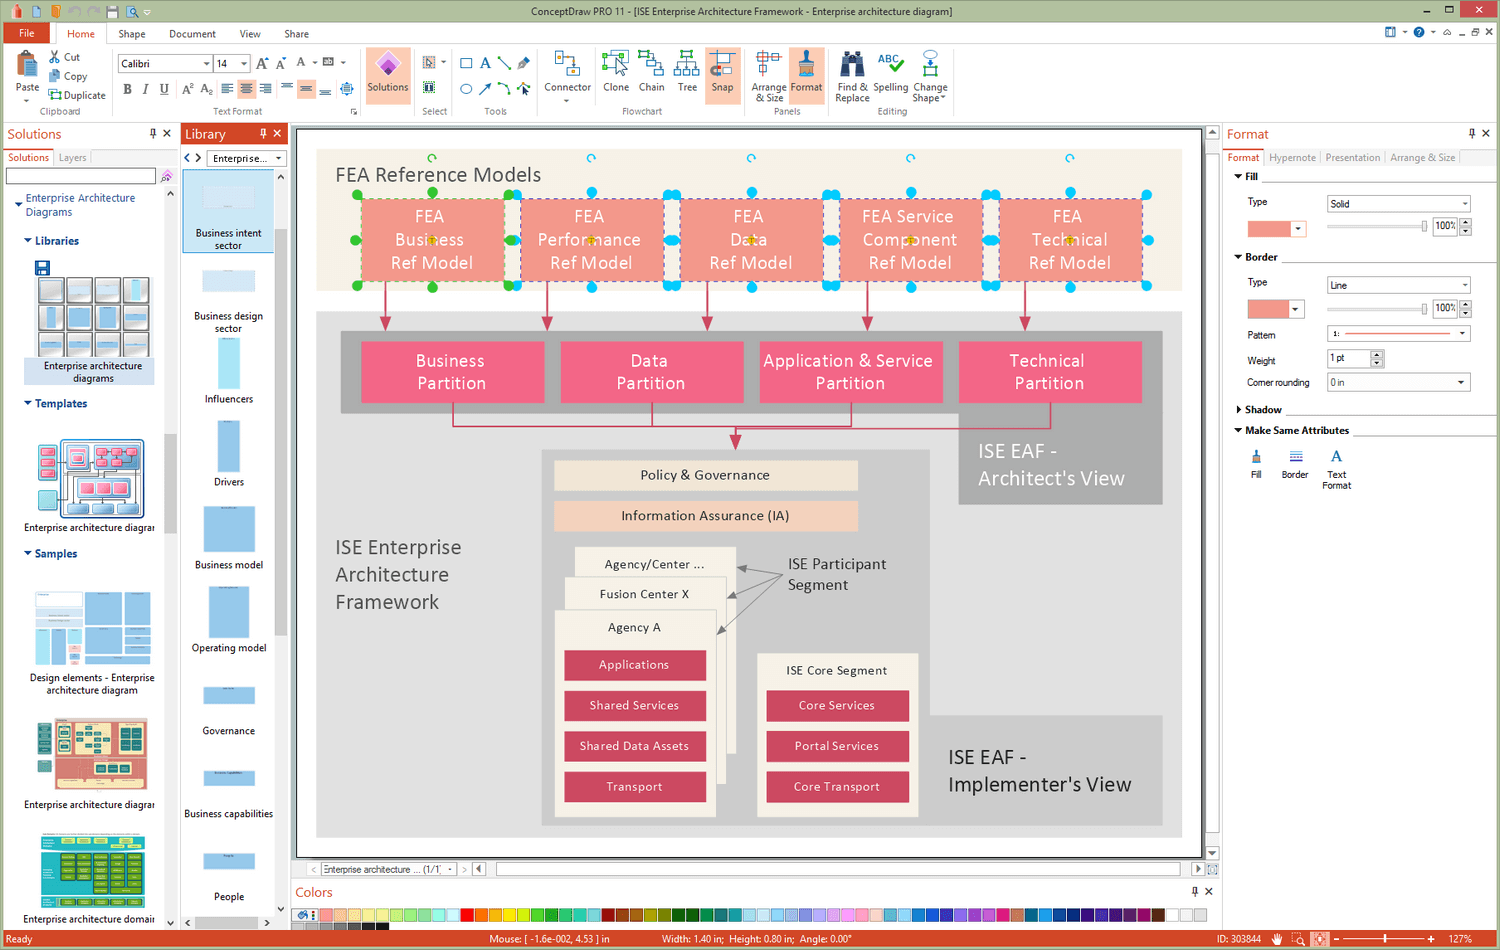
Information Architecture
Venn Diagram Examples for Problem Solving. Venn Diagram as a Truth Table

UML Diagram

Create unified modeling language (UML) diagrams with ConceptDraw.
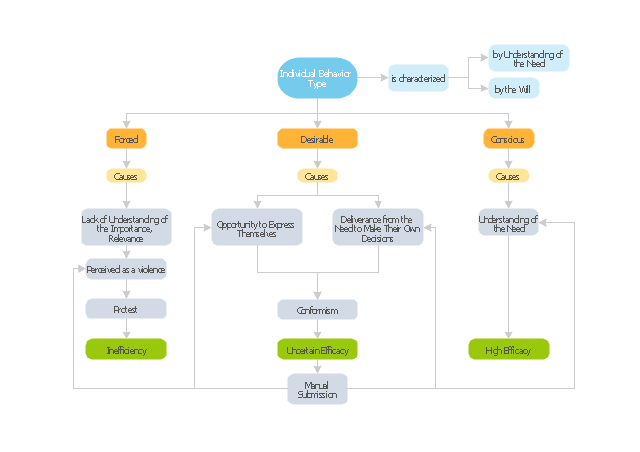
"Organizational behavior is a field of study that investigates the impact that individuals, groups and structures have on behavior within an organization for the purpose of applying such knowledge towards improving an organization's effectiveness. It is an interdisciplinary field that includes sociology, psychology, communication, and management; and it complements the academic studies of organizational theory (which is focused on organizational and intra-organizational topics) and human resource studies (which is more applied and business-oriented). It may also be referred to as organizational studies or organizational science." [Organizational behavior. Wikipedia]
The block diagram example "Types of individual behavior in organization" was created using the ConceptDraw PRO diagramming and vector drawing software extended with the Block Diagrams solution from the area "What is a Diagram" of ConceptDraw Solution Park.
The block diagram example "Types of individual behavior in organization" was created using the ConceptDraw PRO diagramming and vector drawing software extended with the Block Diagrams solution from the area "What is a Diagram" of ConceptDraw Solution Park.
Block diagram
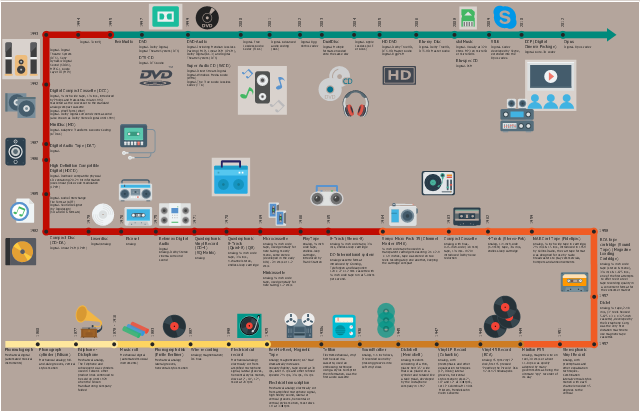
This infographic sample was designed on the base of data from the Wikipedia article "Timeline of audio formats".
"An audio format is a medium for storing sound and music. The term is applied to both the physical recording media and the recording formats of the audio content – in computer science it is often limited to the audio file format, but its wider use usually refers to the physical method used to store the data.
Music is recorded and distributed using a variety of audio formats, some of which store additional information." [Timeline of audio formats. Wikipedia]
The infographic example "Audio format developments" was created using the ConceptDraw PRO diagramming and vector drawing software extended with the Audio, Video, Media solution from the Illustrations area of ConceptDraw Solution Park.
Infographic
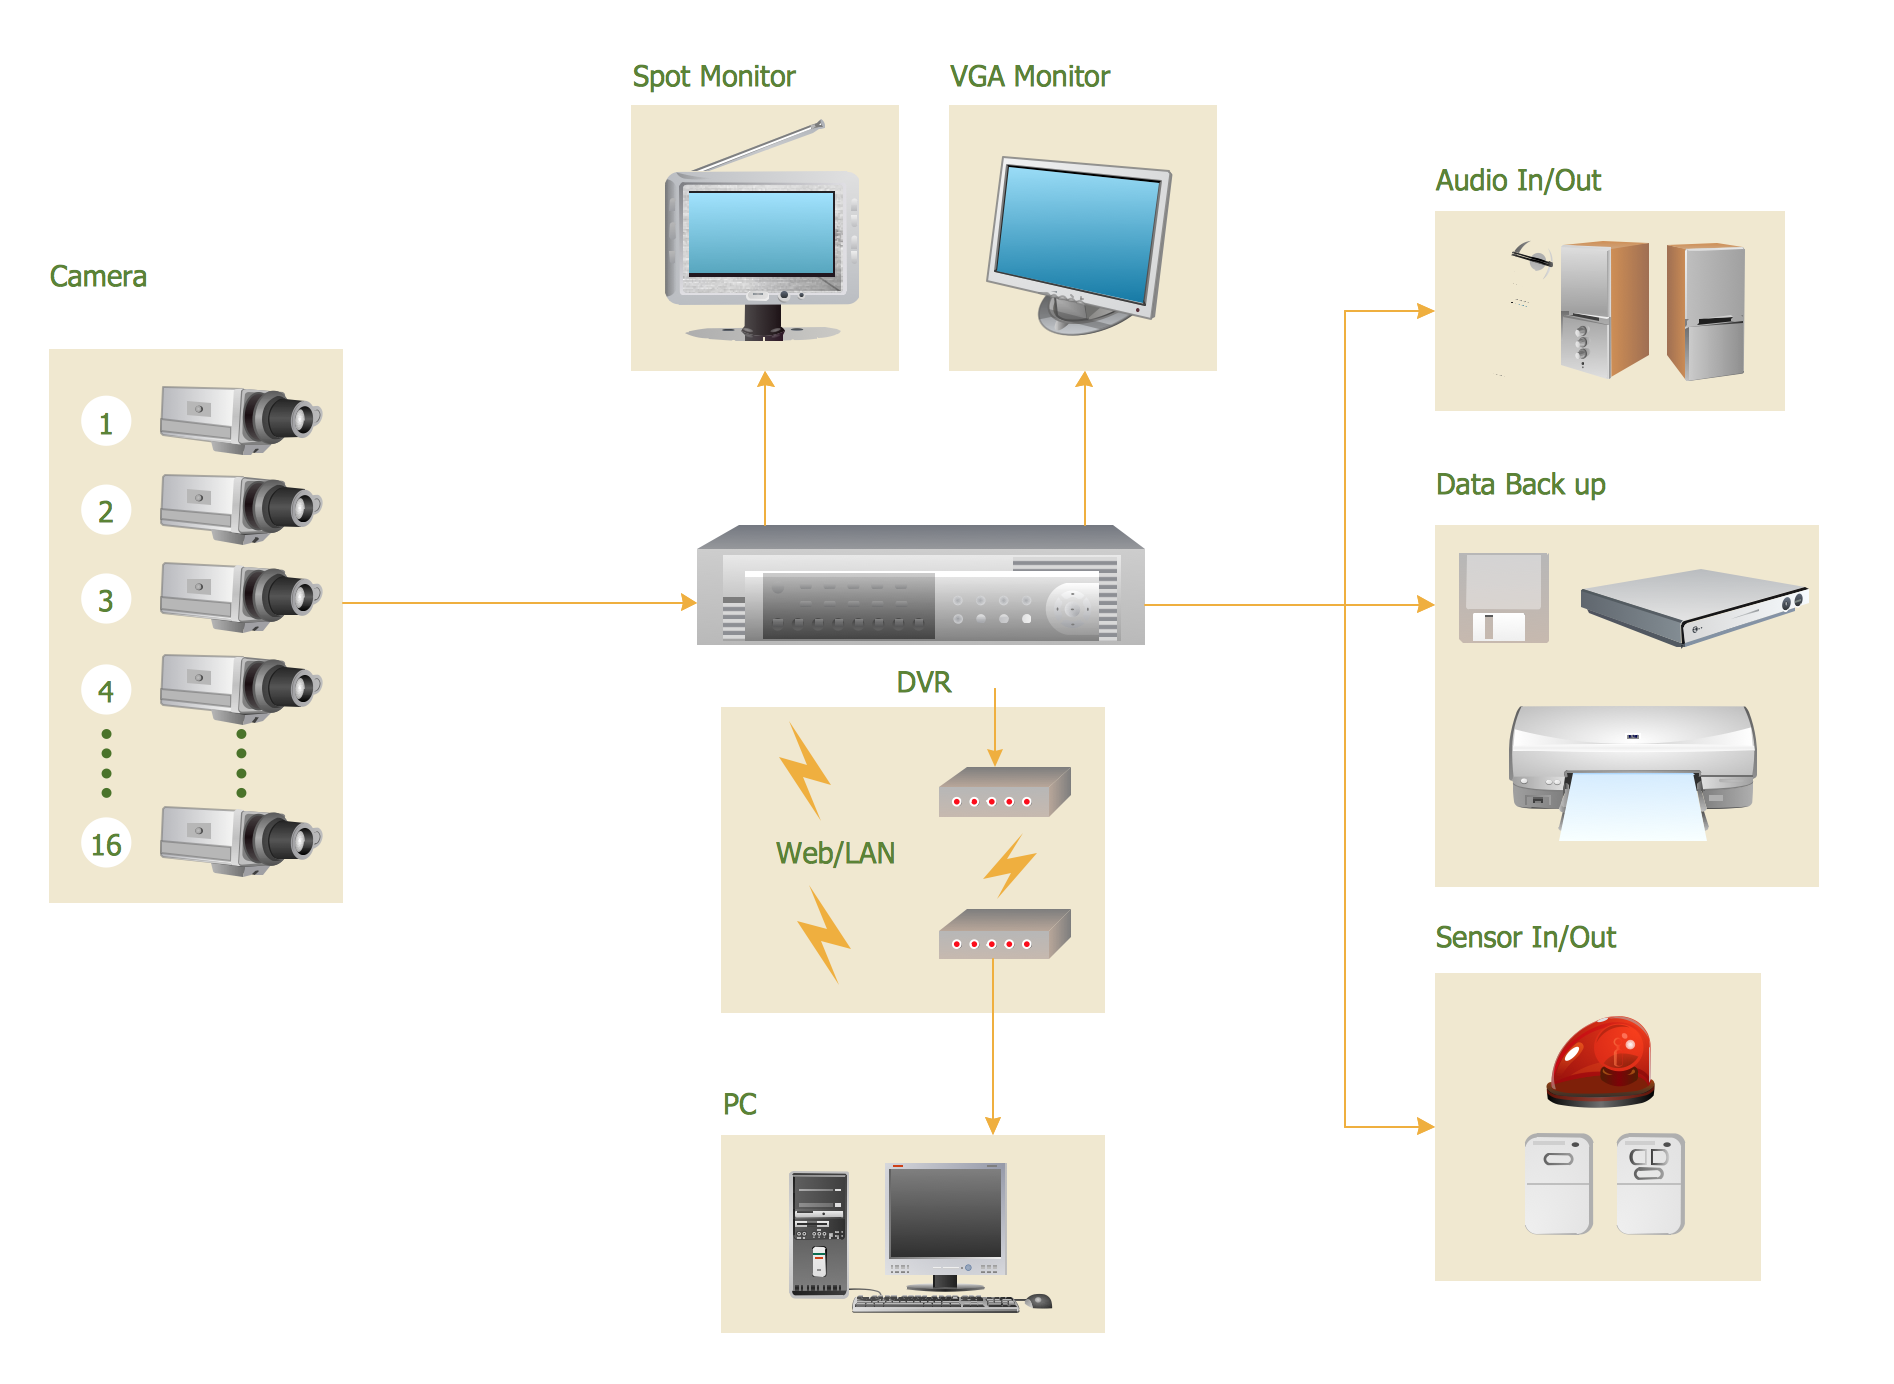
CCTV Surveillance System Diagram. CCTV Network Diagram Example
Structured Systems Analysis and Design Method (SSADM) with ConceptDraw DIAGRAM

Software development with ConceptDraw DIAGRAM

 Seven Basic Tools of Quality
Manage quality control in the workplace, using fishbone diagrams, flowcharts, Pareto charts and histograms, provided by the Seven Basic Tools of Quality solution.
 Accounting Flowcharts
Accounting Flowcharts solution extends ConceptDraw DIAGRAM software with templates, samples and library of vector stencils for drawing the accounting flow charts.
- Applied Science
- Hydraulic schematic | Applied Hydraulic Circuits
- Science Gif
- Physics | Biology | Language Learning | Science Solution Examples
- CAD Drawing Software for Making Mechanic Diagram and Electrical ...
- Hydraulic schematic | Basics Hydraulic Schematic Of A Hydraulic ...
- Mechanical Engineering | Hydraulic schematic | Technical Drawing ...
- Hydraulic schematic | Apparatus for testing the strength of a ...
- Design elements - HVAC equipment | Design elements - Heating ...
- Mechanical Engineering | Mechanical Drawing Symbols ...
- Hydraulic schematic | Retract resistor check valve application ...
- Hydraulic schematic | Mechanical Engineering | Apparatus for ...
- Design elements - Heating equipment | Physics | Design elements ...
- Hydraulic schematic | Hydraulic circuits | Mechanical Drawing ...
- Hydraulic schematic | Mechanical Engineering | Technical Drawing ...
- Design elements - Pumps | Hydraulic schematic | Turbine Pump ...
- Mechanical Drawing Symbols | Mechanical Engineering ...
- Hydraulic schematic | Directional control valve | Directional control ...
- Retract resistor check valve application | Hydraulic schematic ...
- Mechanical Engineering | How to Create a Mechanical Diagram ...
- ERD | Entity Relationship Diagrams, ERD Software for Mac and Win
- Flowchart | Basic Flowchart Symbols and Meaning
- Flowchart | Flowchart Design - Symbols, Shapes, Stencils and Icons
- Flowchart | Flow Chart Symbols
- Electrical | Electrical Drawing - Wiring and Circuits Schematics
- Flowchart | Common Flowchart Symbols
- Flowchart | Common Flowchart Symbols