What Is a Circle Spoke Diagram

Circle Spoke Diagram Template

Circle Diagrams

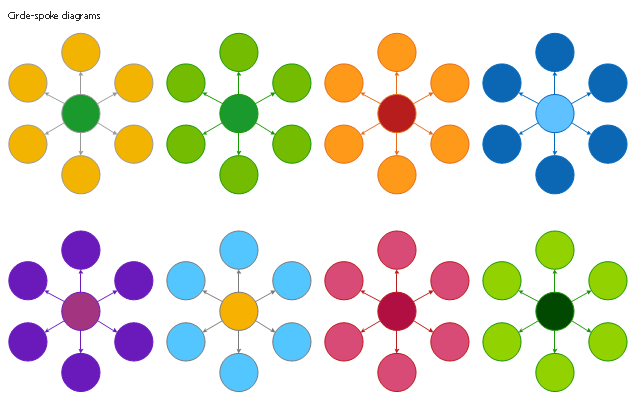
 Basic Circle-Spoke Diagrams
Basic circle-spoke diagrams are well suited for marketing, management documents, and presentations.
HelpDesk
How To Make Visio Circle-Spoke Diagram

HelpDesk
How to Add a Circle-Spoke Diagram to MS Word Document

3 Circle Venn. Venn Diagram Example

HelpDesk
How to Add a Circle-spoke Diagram to PowerPoint

HelpDesk
How to Draw a Circle-Spoke Diagram

Basic Circles Venn Diagram. Venn Diagram Example

This Venn Diagram shows the relative complement of the set A with respect to the set B. It is the set of the elements in B, but not in A. In other words it is the set-theoretic difference B-A.
HelpDesk
How To Convert a Circle-Spoke Diagram to Adobe PDF

Circles Venn Diagram

2 Circle Venn Diagram. Venn Diagram Example

3 Circle Venn Diagram. Venn Diagram Example

Venn Diagrams visualize all possible logical intersections between several sets and are widely used in mathematics, logic, statistics, marketing, sociology, etc.
This circle diagram sample was redesigned from the Wikimedia Commons file: Research cycle.png. "Some of the basic elements of the scientific method, arranged in a cycle to emphasize that it is an iterative process." [commons.wikimedia.org/ wiki/ File:Research_ cycle.png]
This file is licensed under the Creative Commons Attribution 2.0 Generic license. [creativecommons.org/ licenses/ by/ 2.0/ deed.en]
"The scientific method is a body of techniques for investigating phenomena, acquiring new knowledge, or correcting and integrating previous knowledge. To be termed scientific, a method of inquiry must be based on empirical and measurable evidence subject to specific principles of reasoning. ...
Four essential elements of the scientific method are iterations, recursions, interleavings, or orderings of the following:
(1) Characterizations (observations, definitions, and measurements of the subject of inquiry).
(2) Hypotheses (theoretical, hypothetical explanations of observations and measurements of the subject).
(3) Predictions (reasoning including logical deduction from the hypothesis or theory).
(4) Experiments (tests of all of the above)...
A linearized, pragmatic scheme of the four points above is sometimes offered as a guideline for proceeding:
(1) Define a question.
(2) Gather information and resources (observe).
(3) Form an explanatory hypothesis.
(4) Test the hypothesis by performing an experiment and collecting data in a reproducible manner.
(5) Analyze the data.
(6) Interpret the data and draw conclusions that serve as a starting point for new hypothesis.
(7) Publish results.
(8) Retest (frequently done by other scientists).
The iterative cycle inherent in this step-by-step method goes from point 3 to 6 back to 3 again." [Scientific method. Wikipedia]
The circle diagram example "Research cycle" was created using the ConceptDraw PRO diagramming and vector drawing software extended with the Target and Circular Diagrams solution from the Marketing area of ConceptDraw Solution Park.
www.conceptdraw.com/ solution-park/ marketing-target-and-circular-diagrams
Circle diagram

The vector stencils library "Circle-spoke diagram" contains 8 templates for the ConceptDraw PRO diagramming and vector drawing software.
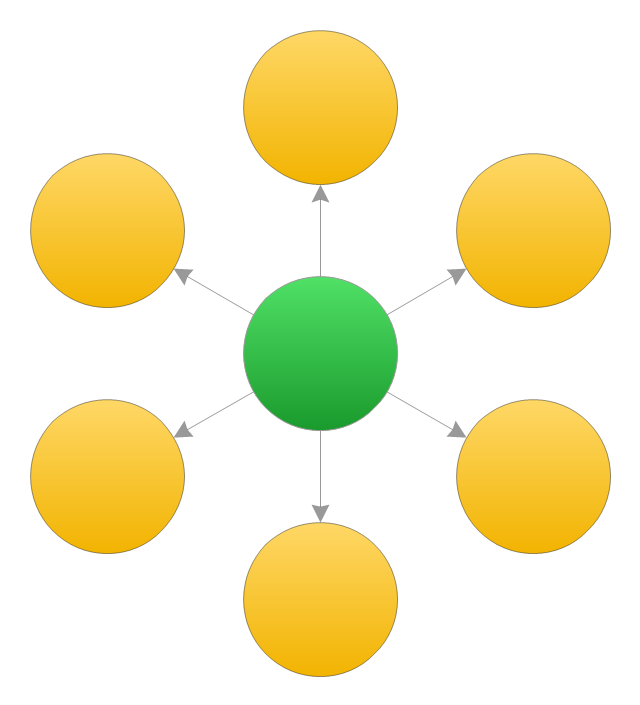
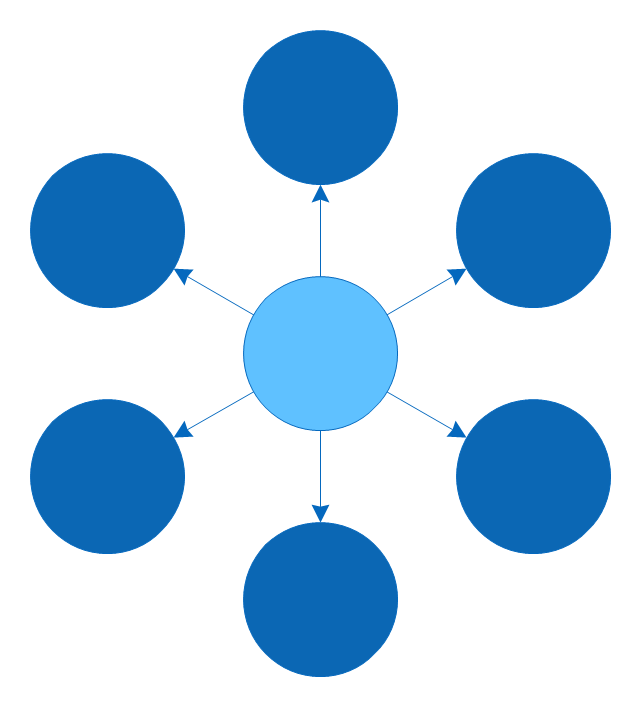
Circle-Spoke Diagrams (Spoke charts) have a central item surrounded by other items in a circle. The circle-spoke diagram is a diagram meant to illustrate that each spoke has equal value. Circle-spoke diagrams are used to show the relationships between a single main element and several satellites.
The circle-spoke diagrams are used to show the features or components of a central item in marketing, management documents and presentations.
The example "Design elements - Circle-spoke diagram" is included in the Circle-Spoke Diagrams solution from the area "What is a Diagram" of ConceptDraw Solution Park.
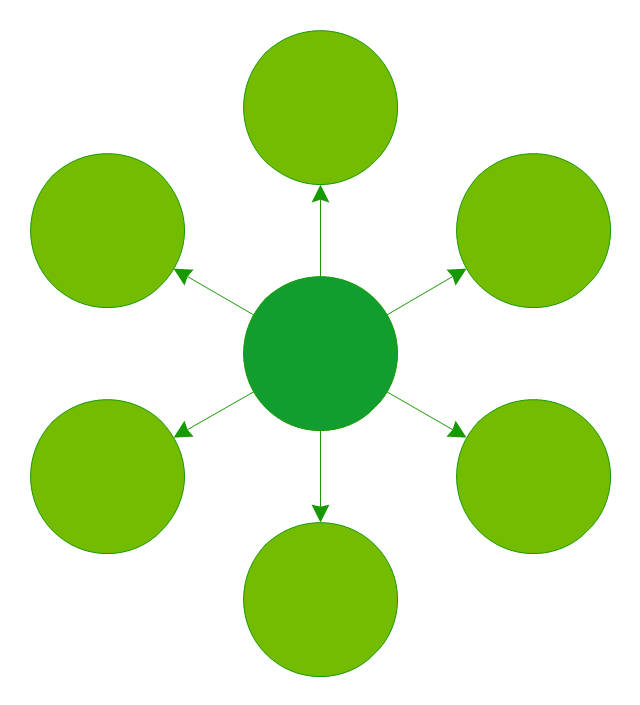
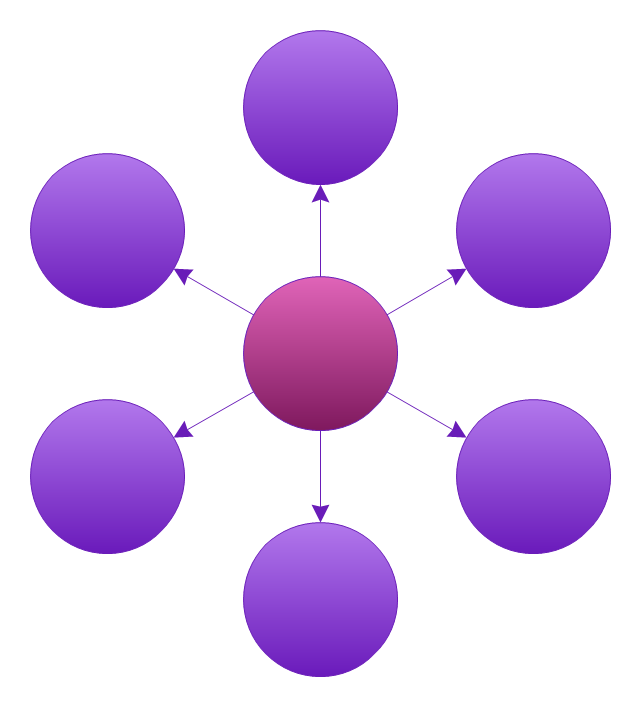
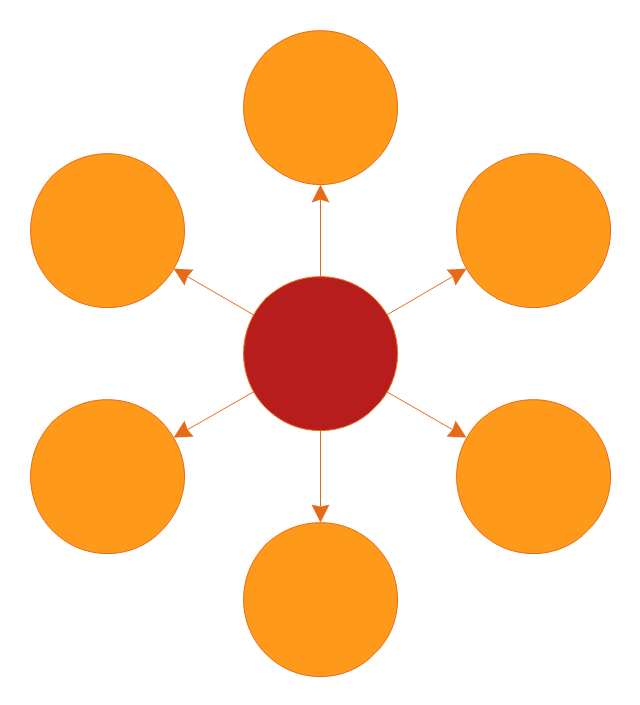
Circle spoke diagram templates
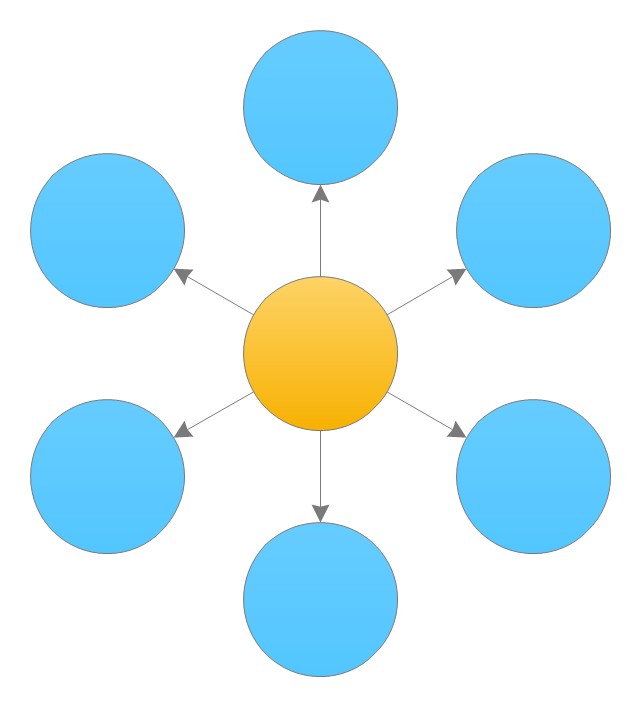
The vector stencils library "Circle-spoke diagram" contains 8 templates of circle-spoke diagrams.
Use these shapes to draw your circle spoke diagrams in the ConceptDraw PRO diagramming and vector drawing software extended with the Circle-Spoke Diagrams solution from the area "What is a Diagram" of ConceptDraw Solution Park.
Use these shapes to draw your circle spoke diagrams in the ConceptDraw PRO diagramming and vector drawing software extended with the Circle-Spoke Diagrams solution from the area "What is a Diagram" of ConceptDraw Solution Park.
Circle-Spoke Diagram 1
Circle-Spoke Diagram 2
Circle-Spoke Diagram 3
Circle-spoke diagram 4
Circle-Spoke Diagram 5
Circle-Spoke Diagram 6
Circle-Spoke Diagram 7
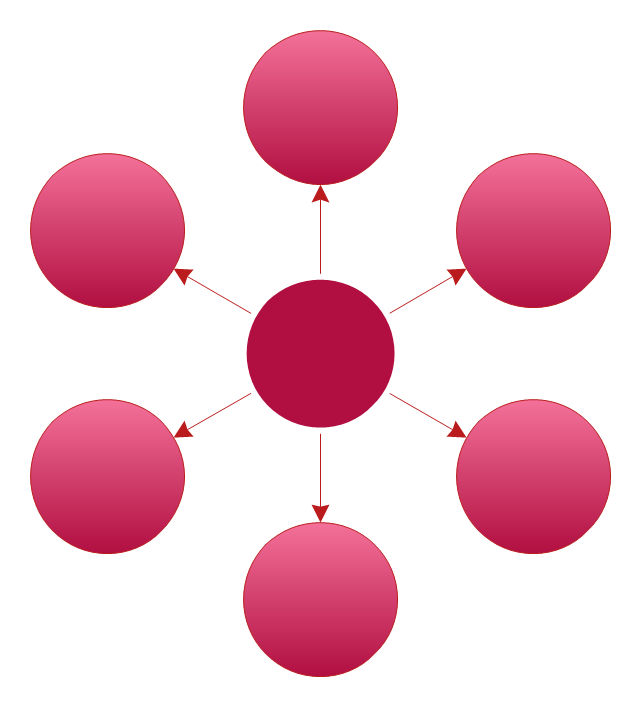
Circle-Spoke Diagram 8
Use this template of arrow circle chart (circle arrow diagram, segmented cycle diagram) in the ConceptDraw PRO diagramming and vector drawing software to visualize progression or continuing sequence of stages, tasks or events as circular flow.
The template "Arrow circle chart" is included in the Pie Charts solution of the Graphs and Charts area in ConceptDraw Solution Park.
The template "Arrow circle chart" is included in the Pie Charts solution of the Graphs and Charts area in ConceptDraw Solution Park.
Donut chart
This hexagon diagram sample was redesigned from the Wikipedia file: Virtuous circle in macroeconomics.svg. "An example of the use of a virtuous circle in macroeconomics."
[en.wikipedia.org/ wiki/ File:Virtuous_ circle_ in_ macroeconomics.svg]
"A virtuous circle and a vicious circle (also referred to as virtuous cycle and vicious cycle) are economic terms. They refer to a complex chain of events that reinforces itself through a feedback loop. A virtuous circle has favorable results, while a vicious circle has detrimental results.
Both circles are complexes of events with no tendency towards equilibrium (at least in the short run). Both systems of events have feedback loops in which each iteration of the cycle reinforces the previous one (positive feedback). These cycles will continue in the direction of their momentum until an external factor intervenes and breaks the cycle. The prefix "hyper-" is sometimes used to describe these cycles if they are extreme. The best-known example of a vicious circle is hyperinflation. ...
Example in macroeconomics.
Virtuous circle.
Economic growth can be seen as a virtuous circle. It might start with an exogenous factor such as technological innovation. As people get familiar with the new technology, there could be learning curve effects and economies of scale. This could lead to reduced costs and improved production efficiencies. In a competitive market structure, this will probably result in lower average prices or a decrease in employment as it takes fewer workers to produce the same output. As prices decrease, consumption could increase and aggregate output also. Increased levels of output lead to more learning and scale effects and a new cycle starts."
[en.wikipedia.org/ wiki/ Virtuous_ circle_ and_ vicious_ circle]
The crystal diagram example "Virtuous circle (macroeconomics)" was created using the ConceptDraw PRO diagramming and vector drawing software extended with the Target and Circular Diagrams solution from the Marketing area of ConceptDraw Solution Park.
www.conceptdraw.com/ solution-park/ marketing-target-and-circular-diagrams
Hexagon diagram
---crystal-diagram.png--diagram-flowchart-example.png)
This ring chart sample was redesigned from the Wikipedia file: Virtuous circle in management.svg.
"An example of the use of a virtuous circle in management."
[en.wikipedia.org/ wiki/ File:Virtuous_ circle_ in_ management.svg]
"A virtuous circle and a vicious circle (also referred to as virtuous cycle and vicious cycle) are economic terms. They refer to a complex chain of events that reinforces itself through a feedback loop. A virtuous circle has favorable results, while a vicious circle has detrimental results.
Both circles are complexes of events with no tendency towards equilibrium (at least in the short run). Both systems of events have feedback loops in which each iteration of the cycle reinforces the previous one (positive feedback). These cycles will continue in the direction of their momentum until an external factor intervenes and breaks the cycle. The prefix "hyper-" is sometimes used to describe these cycles if they are extreme. The best-known example of a vicious circle is hyperinflation. ...
Example in management.
Virtuous circle.
An employer's investment in his employees’ ability to provide superior service to customers can be seen as a virtuous circle. Effort spent in selecting and training employees and creating a corporate culture in which they are empowered can lead to increased employee satisfaction and employee competence. This can result in superior service delivery and customer satisfaction. This in turn will create customer loyalty, improved sales levels, and higher profit margins. Some of these profits can be reinvested in employee development, thereby initiating another iteration of a virtuous cycle." [en.wikipedia.org/ wiki/ Virtuous_ circle_ and_ vicious_ circle]
The ring chart example "Virtuous circle (management)" was created using the ConceptDraw PRO diagramming and vector drawing software extended with the Target and Circular Diagrams solution from the Marketing area of ConceptDraw Solution Park.
www.conceptdraw.com/ solution-park/ marketing-target-and-circular-diagrams
Ring chart
---ring-chart.png--diagram-flowchart-example.png)
- Venn Diagram 4 Circles Problems
- How To Draw Proportional Divided Circle
- Circle -Spoke Diagrams
- How To Create a Visio Circle -Spoke Diagram Using ConceptDraw ...
- How to Draw a Circle -Spoke Diagram Using ConceptDraw PRO ...
- Stakeholder Mapping Tool | Circle Spoke Diagram Template ...
- What Is a Circle Spoke Diagram
- Social determinants of health | Circle -Spoke Diagrams | Circle ...
- Circles Venn Diagram
- Circle -spoke diagram - Vector stencils library
- Circle -Spoke Diagrams | Circular diagrams - Vector stencils library ...
- Circles Venn Diagram
- Circle Spoke Diagram Template | 3 Circle Venn. Venn Diagram ...
- 3 Circle Venn. Venn Diagram Example
- Circle Diagrams | Circle -Spoke Diagrams | Circles Venn Diagram ...
- Circle Spoke Diagram Template | Target Diagram | Target diagrams ...
- Arrow circle chart - Template | Exploded pie chart - Template | Chart ...
- Circle -Spoke Diagrams | How to Create Flowchart Using Standard ...
- Circle Diagrams | Circular Diagram | Best Diagramming | Circle ...
- 3 Circle Venn Diagram. Venn Diagram Example
- ERD | Entity Relationship Diagrams, ERD Software for Mac and Win
- Flowchart | Basic Flowchart Symbols and Meaning
- Flowchart | Flowchart Design - Symbols, Shapes, Stencils and Icons
- Flowchart | Flow Chart Symbols
- Electrical | Electrical Drawing - Wiring and Circuits Schematics
- Flowchart | Common Flowchart Symbols
- Flowchart | Common Flowchart Symbols