Software Diagrams
Development of Software with ConceptDraw DIAGRAM
ConceptDraw is a tool for technical and business graphics. It provides specialists who create graphic documentation with a possibility to focus not on the process of drawing itself but on the essence of the task. For this ConceptDraw features a huge number of ready-to-use objects (4590 for the moment of writing the article), smart connectors, layers, hyperlinks and many other possibilities.
Design and document development of projects using a wide range of pre-drawn shapes and smart connectors. Develop visualization solutions with the help of the built-in scripting language.
ConceptDraw DIAGRAM is a perfect tool for:
- Designing and planning tasks such as:
- Jacobson Use Cases Diagram
- SSADMN Diagram
- Yourdon and Coad Diagram
- Command OLE Diagram
- Block Diagrams
- Data Modeling Diagram
- SysML Diagram
- Chen RED Diagram
- Martin RED Diagram
- IDEF0 Diagram
- Booch OOD Diagram
- Gane Sarson Diagram
- Memory Object Diagram
- Data Flow Diagram
- FlowCharts
- Graphic User Interface (GUI)
- UML Diagram
- Program Structure Diagrams
- ORM Diagram
- Developing Visualization Solutions
- Project Planning (Gantt Charts, Timelines, Project Schedules)
Modern development of program software leads to a large amount of graphic documentation: diagrams describing the work of applications in various cuts and notations, GUI design, documentation on project management. Each of these fields is represented by topical libraries and templates.
To ConceptDraw DIAGRAM new possibilities have been added, thanks to which the program became a sequence higher useful for developers. The most considerable innovations are:
- a set of wizards for automation of widespread tasks built-in scripting language, which helps to automate tasks specific for your
- particular situation.
Let us consider typical applications.
Object-oriented design
Over the recent years object-oriented methodology has become more and more widespread. Thanks to this methodology developers manage to deal with growing complexity of applications. More and more programs are written in such programming languages as C++, Java, Visual Basic and Object Pascal. However, the complexity of the designed systems imposes extended requirements as to design of graphic documentation. ConceptDraw possesses powerful tools for designing of technical documentation for object-oriented projects. The libraries included in the package allow to easily draw class hierarchies, object hierarchies and diagrams of data flows with the use of the most popular notations, including UML and Booch notations. And the library for projecting COM-interfaces will spare developers of ActiveX-servers a headache.
Flowcharts of algorithms and business-processes
Flowcharting is a conventional way of recording algorithms in a graphic form. ConceptDraw is an ideal means for their creation. Easiness of flowcharting in ConceptDraw is really impressive. This functionality is useful for students and teachers of informatics.
At development of real application flowcharts are widely used for clearing processes on which business-logics of the application will be based.
Prototyping Graphical User Interface (GUI)
ConceptDraw allows to more tightly draw art designers, managers and users to the process of GUI design. Now libraries of controls for Windows XP, MacOS and MacOS X are available to all of them and they can share their vision of Windows, menu and web-forms on various platforms with developers.
Project management
For a large-scale project to be completed successfully it should be thoroughly projected. One of the generally recognized and visual tools for projecting and tracking timeliness of the work on a project is a Gantt chart. ConceptDraw offers the wizard for automatic creation of Gantt chart.
The other side of the question of project management is the dynamism of changes. Changes in a project and its documentation are made daily. All updates should be done in time and be available to each developer. ConceptDraw offers many methods of solving this question:
- Cross platform compatibility. ConceptDraw is released in two versions: for PC and for Mac. Its files can be easily read by the both versions. It means you can exchange documents with your colleagues and partners working on different platforms.
- Export to HTML provides the possibility of getting a set of ready web-pages based on a ConceptDraw file, which can be displayed in intranet or Internet for all who care.
- Export to PDF and graphic formats are designed, first of all, for sending information via e-mail.
Automation of management and development process
ConceptDraw DIAGRAM supports XML. XML for ConceptDraw has been created and, at the same time, support for import XML for Visio. All this allows to develop solutions for automation of various aspects of software development.
For instance:
- generation of UML diagrams etc. on the ready initial code
- generation of the initial code
- generation of resources for Windows and MacOS, web-forms
- and a lot more
Visualization of data
ConceptDraw is a good means for visualization of information of any kind. The program features powerful graphic possibilities. Thus, on the ready graphic kernel ConceptDraw the rest products of the line have been developed: ConceptDraw PROJECT, ConceptDraw MINDMAP This powerful graphic kernel (2D-graphics) is supported by a number of open formats (including XML). To this add the flexibility of data processing, connected with the scripting language ConceptDraw Basic (included in version V), and also the flexibility in parameterization of objects, which is provided by the whole table of the object parameters (which is available for editing even from the program's interface). So in the end it becomes clear that visualizing of information in ConceptDraw is a good idea.
So, the typical task for ConceptDraw Basic is to automate the visualization of some data. This data can be obtained as the result of work of an arbitrary application (including ConceptDraw-script) and saved in a text file, ODBC-compatible database or in one of the open formats supported by ConceptDraw. In the first two cases, data will further be read and visualized with the help of ConceptDraw Basic. In case of using a ConceptDraw open format (XML for ConceptDraw or XML for Visio) the obtained document can be simply opened in ConceptDraw, you can then add some details of design and get a presentable diagram. Possibilities of ConceptDraw Basic considerably increase at using in script the functions exported by the shared libraries.
The conclusion is: ConceptDraw is a platform worth considering for writing solutions, connected with data visualization.
Work with databases
Special attention has been given to work with databases. There are libraries for designing databases in various notations: ORM, Chen ERD and Martin ERD, Express-G and relational diagrams. Starting from version V, ConceptDraw supports ODBC-compatible databases. Interaction with them is possible with the help of the scripting language ConceptDraw Basic. Besides, in ConceptDraw Professional package there is Database Model Diagram wizard (it can be found among the templates of the section ERD & Database). It builds a model of an arbitrary presented by the user in the form of DSN database.
Having applied all said above about possibilities of ConceptDraw in fields of projection, automation and visualization of data, we can conclude, that the program is well designed for solving the following tasks:
- design of databases
- ORM-diagrams
- ER-diagrams
- relational diagrams
- reengineering of databases
- visual displaying of data in the form of charts and diagrams

Example 1. Data Flow Diagram
TEN RELATED HOW TO's:UML Diagrams Social Networking Sites Project. This sample was created in ConceptDraw DIAGRAM diagramming and vector drawing software using the UML Use Case Diagram library of the Rapid UML Solution from the Software Development area of ConceptDraw Solution Park. This sample shows the Facebook Socio-health system and is used at the projection and creating of the social networking sites. Picture: UML Use Case Diagram Example. Social Networking Sites ProjectRelated Solution:Create flowcharts, flow charts, and more with ConceptDraw flowchart software.
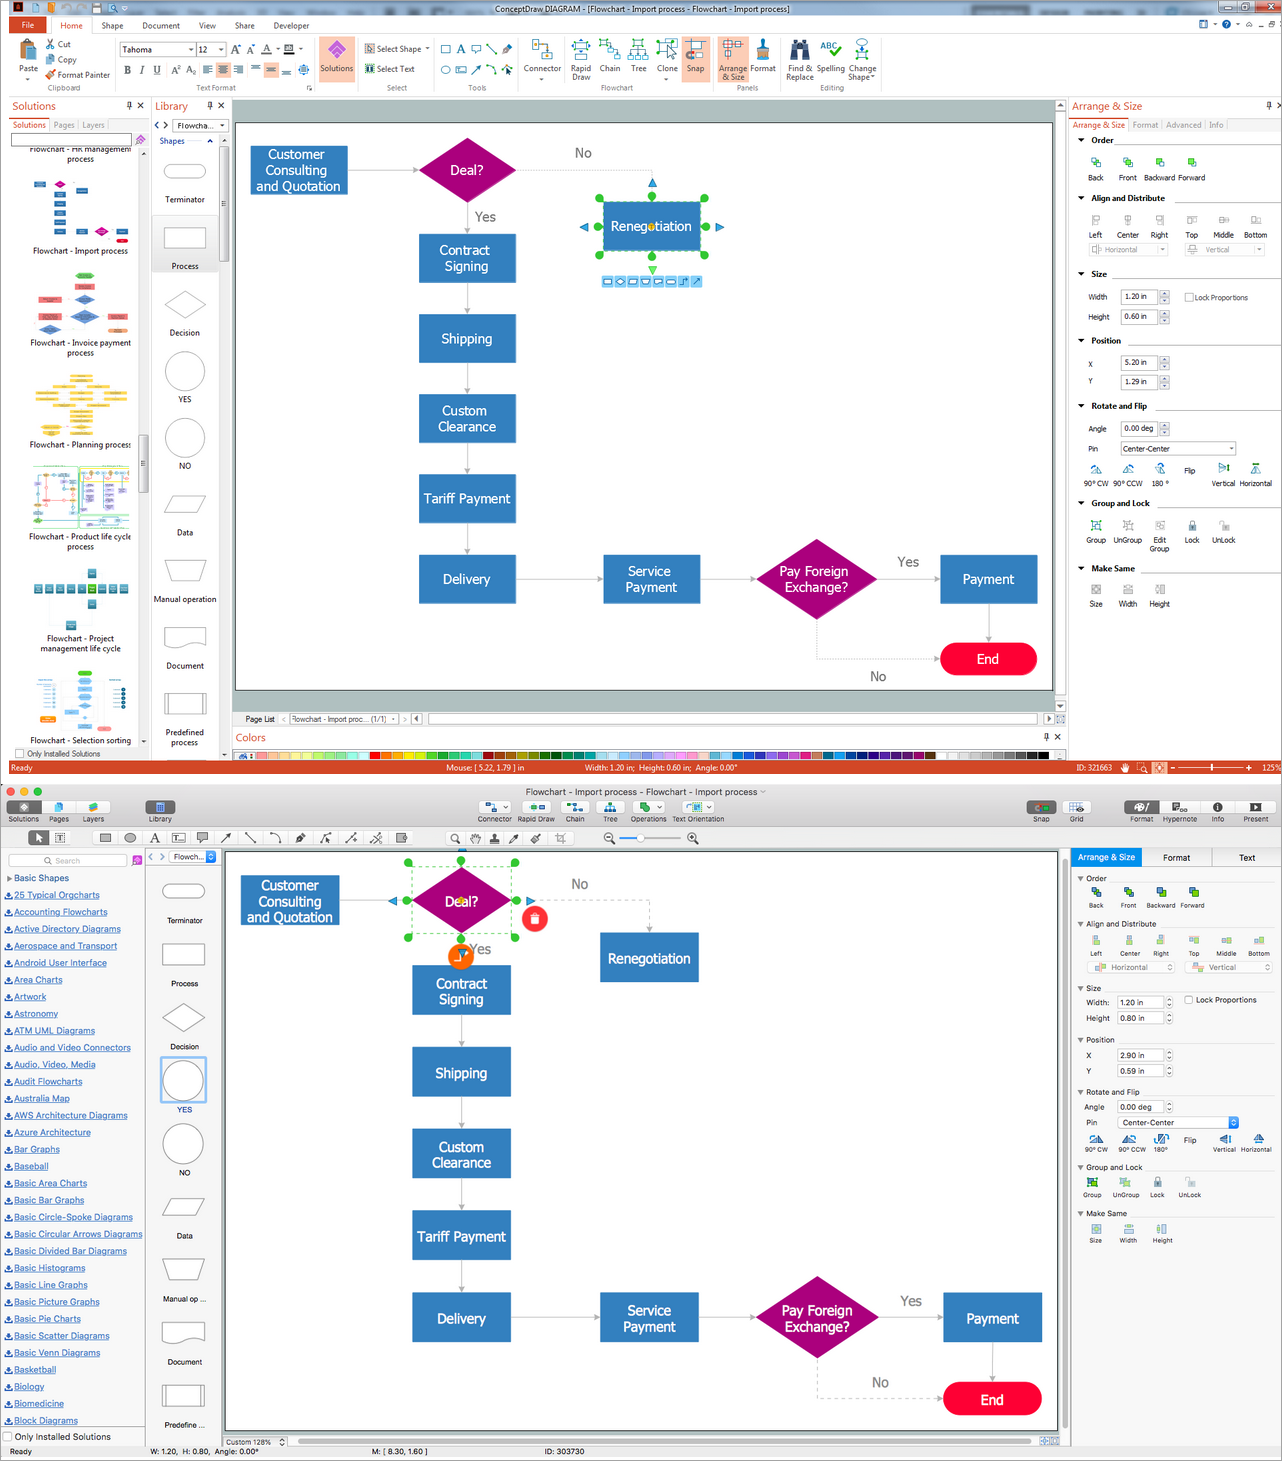 Picture: Basic Diagramming. Flowchart SoftwareRelated Solution:A flowchart is a simple but very functional tool when it comes to understanding a workflow or to removing unnecessary stages from a process. When drawing flowcharts, keep in mind that there are four common types of flowcharts, like document flowcharts and data flowcharts that show control over a data or document flow over a system. To show controls on a physical level, use system flowcharts. In addition, to show controls in a program, you can draw a program flowchart. This flowchart diagram represents the piece of an article editing process, that involves the author and editor. It was created using the Basic Flowchart notation that consists from the basic flowchart symbols. The start and the end of the process are indicated with "Terminator" symbols. The "Process" symbols show the action steps consisting from making edits and searching for a compromise, when the author does not agree with the suggestions of the editor. The "Process" symbol is the general symbol in process flowcharts. The "Decision" symbol indicates a branching in the process flow. There are two branches indicated by a Decision shape in the current flowchart (Yes/No, Disagree/Agree). This basic flowchart can be used as a repeating unit in the workflow diagram describing the working process of some editorial office.
 Picture: Types of FlowchartsRelated Solution:Data base diagrams describes inter-related data and tables. It describes roles and relationships, internal and external dependencies, data exchange conventions and structures of knowledge domain. ConceptDraw Software provides number of data-base chart libraries including major 49 vector symbols. Use these DFD flowchart symbol libraries to design data-base structure and models, use it to design data base process-oriented models, or simple data-oriented models. The are special drawing tools for making data flowcharts, data process diagrams, structured analysis diagrams, and information flow diagrams.
 Picture: Database Flowchart SymbolsRelated Solution:ConceptDraw DIAGRAM is a powerful tool for business and technical diagramming. Software Development area of ConceptDraw Solution Park provides 5 solutions: Data Flow Diagrams, Entity-Relationship Diagram (ERD), Graphic User Interface, IDEFO Diagrams, Rapid UML.
 Picture: Software Diagram Examples and TemplatesRelated Solution:ConceptDraw DIAGRAM is a powerful intelligent vector graphics engine that can be used to create basic diagrams including flowcharts, charts, workflows, flowcharts, organizational charts, business diagram, learn business diagrams, flow diagrams.
 Picture: The Best Mac Software for Diagramming or DrawingRelated Solution:A flowchart is a powerful tool for examining processes. It helps improving processes a lot, as it becomes much easier to communicate between involved people, to identify potential problems and to optimize workflow. There are flowcharts of different shapes, sizes and types of flowchart vary from quite basic process flowcharts to complex program flowcharts. Nevertheless, all these diagrams use the same set of special symbols like arrows to connect blocks, parallelogram to show data receiving or rectangles for showing process steps. Basic flowcharts are used to represent a simple process algorithm. A basic flowchart notation consists of rectangles (business processes), arrows (the flow of information, documents, etc.). The same notation is used in items such as the "decision", which allow you to do the branching. To indicate the start of the entire business process and its termination can be used the "Terminator" element. The advantages of Basic Flowchart are simplicity and clarity. With it you can quickly describe the business process steps. Creating of Basic Flowchart does not require any special knowledge, as easily understand by employees with different levels of education and IQ.
 Picture: Types of Flowchart — OverviewRelated Solution:A Process Flow Chart is a type of flowchart which is mostly used in industrial, chemical and process engineering for illustrating high-level processes, major plant processes and not shows minor details. ConceptDraw DIAGRAM diagramming and vector drawing software extended with Flowcharts Solution from the Diagrams Area of ConceptDraw Solution Park is the best way to create Process Flow Chart and other types of flowcharts.
 Picture: Process Flow ChartRelated Solution:Create your own Linux audit flowcharts using the ConceptDraw DIAGRAM diagramming and vector drawing software extended with the Audit Flowcharts solution from the Finance and Accounting area of ConceptDraw Solution Park. This flowchart example describing auditd, the linux audit tool.
 Picture: Linux Audit Flowchart Example. Flowchart ExamplesRelated Solution:ConceptDrawDIAGRAM 18