
Sales Growth. Bar Graphs Example
This sample was created in ConceptDraw PRO diagramming and vector drawing software using the Bar Graphs Solution from Graphs and Charts area of
Bar Chart Examples
These bar chart examples was designed using ConceptDraw PRO diagramming and vector drawing software extended with Bar Graphs solution from Graphs
 Bar Graphs Solution. ConceptDraw.com
Bar graphs solution extends ConceptDraw PRO software with templates, This
example was created in ConceptDraw PRO using the Bar Charts Library from

Bar Graph
"A bar graph is a chart that uses either horizontal or vertical bars to show comparisons This sample was created in ConceptDraw PRO using the Bar Graphs
Financial Comparison Chart.<br> Bar Graphs Example
This sample was created in ConceptDraw PRO diagramming and vector drawing software using the Bar Graphs Solution from Graphs and Charts area of
Bar Diagrams for Problem Solving. Space Science
Software for Bar Diagrams for Problem Solving. Example 1. Software for create Bar Charts, Graphs and Diagrams. Free Download Bar Chart Software and View
Bar Chart Software
"A bar chart or bar graph is a chart with rectangular bars with lengths proportional to the values that Free Download Bar Chart Software and View All Examples .
Bar Diagrams for Problem Solving. Manufacturing and Economics
Create manufacturing and economics bar charts with Bar Graphs Solution Vertical bar chart example - Change in Productivity within the Manufacturing Sector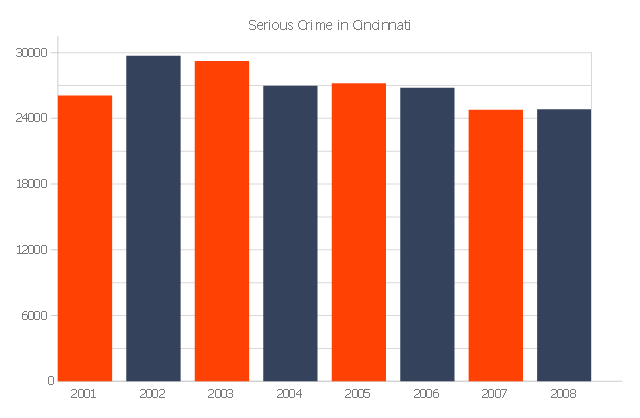
The bar graph example "Serious Crime in Cincinnati" was redesigned from the
Commons Wikimedia file: Cincinnati-Part-1-Crimes.jpg.

Bar Chart
Example 1. Bar Chart in ConceptDraw PRO. Bar Graphs Solution provides collection of predesigned templates and samples which you can see in ConceptDraw
Bar Diagrams for Problem Solving. Business Management
Problem Solving. Create business management bar charts with Bar Graphs Solution Vertical bar chart example - External Executives: Time-to-Productivity.
Column Chart Software
"A bar graph is a chart that uses either horizontal or vertical bars to show comparisons among Column chart example - Iran internet users per 100 person.
Bar Diagrams for Problem Solving. Event Management
Create event management bar charts with Bar Graphs Solution Free Download Bar Chart Software and View All Examples · bar diagram for problem solving
 Divided Bar Diagrams Solution. ConceptDraw.com
A Divided Bar graph is a rectangle divided into smaller rectangles along its
length in This example was created in ConceptDraw PRO using the Divided
Bar

Bar Diagrams for Problem Solving. Economics and Financial
Create bar graphs for visualizing economics problem solving and financial data comparison using Free Download Bar Chart Software and View All Examples .
HelpDesk
Draw Divided Bar Chart. ConceptDraw HelpDesk
ConceptDraw PRO allows you to draw a simple and clear Bar Chart using the Divided Bar Diagrams A divided bar graph is a rectangle divided into smaller rectangles along its length in proportion to the data. Divided bar chart example .---double-bar-chart.png--diagram-flowchart-example.png)
Year.html] The double bar graph example "Nitrate concentration in Community
Water Systems (CWS)" was created using the ConceptDraw PRO diagramming

Bar Charts
Example 1. Bar Charts - Composition of lunar soil. Bar Graphs Solution provides large quantity of drawing tools, variety of templates and samples which will be
Stacked Graph
Example 1. Stacked Graph in ConceptDraw PRO. Divided Bar Diagrams solution extends ConceptDraw PRO v.9.5 (or later) with templates, samples and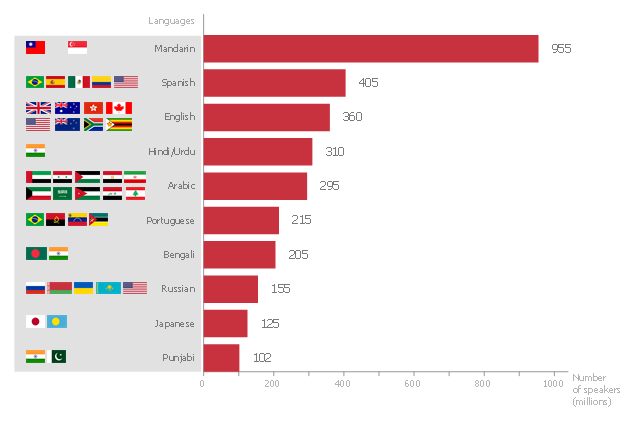
Wikipedia] The horizontal bar chart example "The most spoken languages of the
software extended with the Bar Graphs solution from the Graphs and Charts
- Sales Growth. Bar Graphs Example | Financial Comparison Chart ...
- Sales Growth. Bar Graphs Example | Sales Dashboard | Sales ...
- Sales Growth. Bar Graphs Example
- Bar Graphs | Sales Growth. Bar Graphs Example | Bar Graph | Bar ...
- Bar Graphs | Picture Graphs | Line Graphs | Graphs
- Bar Chart Examples | Bar Chart Software | Bar Graphs | Bar Graph
- Bar Graphs | Bar Graph | Sales Growth. Bar Graphs Example | Bar ...
- Sales Growth. Bar Graphs Example | Bar Diagrams for Problem ...
- Bar Chart Examples | Column Chart Examples | Bar Graphs
- Financial Comparison Chart | Sales Growth. Bar Graphs Example ...
- Sales Growth. Bar Graphs Example | Sales department - Vector ...
- Bar Chart Examples | Sales Growth. Bar Graphs Example | Financial ...
- Double bar graph template | Double bar chart - Changes in price ...
- Bar Chart Software | Bar Chart Examples | Column Chart Software
- Bar Graphs | Double bar chart - Changes in price indices | Bar ...
- Bar Graphs | Blank Scatter Plot | Basic Diagramming | Sample Bar ...
- Bar Chart Software | Column Chart Software | Bar Chart Examples
- Bar graph - Serious Crime in Cincinnati | Chart Examples | Column ...
- Create Graphs and Charts | Sales Growth. Bar Graphs Example ...
- Bar Chart Software | Sales Growth. Bar Graphs Example | Column ...
- ERD | Entity Relationship Diagrams, ERD Software for Mac and Win
- Flowchart | Basic Flowchart Symbols and Meaning
- Flowchart | Flowchart Design - Symbols, Shapes, Stencils and Icons
- Flowchart | Flow Chart Symbols
- Electrical | Electrical Drawing - Wiring and Circuits Schematics
- Flowchart | Common Flowchart Symbols
- Flowchart | Common Flowchart Symbols