IDEF0 Flowchart Symbols

Entity Relationship Diagram Symbols

Flow Chart Symbols

Basic Flowchart Symbols and Meaning


IDEF0 Visio

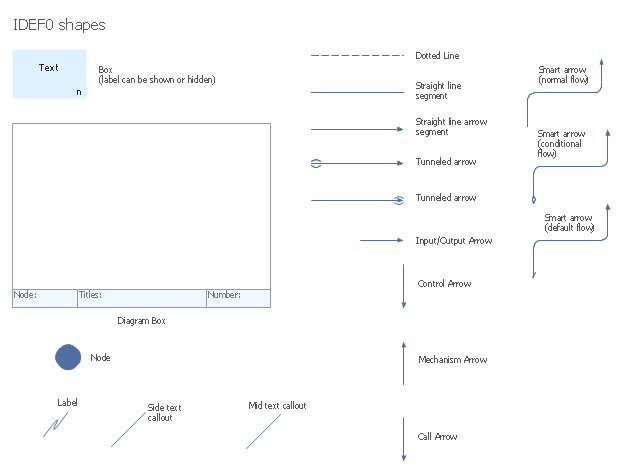
The vector stencils library "IDEF0 diagrams" contains 18 symbols for drawing IDEF0 function modeling diagrams using the ConceptDraw PRO diagramming and vector drawing software.
"The IDEF0 model ... is based on a simple syntax. Each activity is described by a verb-based label placed in a box. Inputs are shown as arrows entering the left side of the activity box while output are shown as exiting arrows on the right side of the box. Controls are displayed as arrows entering the top of the box and mechanisms are displayed as arrows entering from the bottom of the box. Inputs, Controls, Outputs, and Mechanisms are all referred to as concepts.
- Arrow : A directed line, composed of one or more arrow segments, that models an open channel or conduit conveying data or objects from source (no arrowhead) to use (with arrowhead). There are 4 arrow classes: Input Arrow, Output Arrow, Control Arrow, and Mechanism Arrow (includes Call Arrow). See Arrow Segment, Boundary Arrow, Internal Arrow.
- Box : A rectangle, containing a name and number, used to represent a function.
- Context : The immediate environment in which a function (or set of functions on a diagram) operates.
- Decomposition : The partitioning of a modeled function into its component functions.
- Fork : The junction at which an IDEF0 arrow segment (going from source to use) divides into two or more arrow segments. May denote unbundling of meaning.
- Function : An activity, process, or transformation (modeled by an IDEF0 box) identified by a verb or verb phrase that describes what must be accomplished.
- Join : The junction at which an IDEF0 arrow segment (going from source to use) merges with one or more other arrow segments to form a single arrow segment. May denote bundling of arrow segment meanings.
- Node : A box from which child boxes originate; a parent box. See Node Index, Node Tree, Node Number, Node Reference, Diagram Node Number." [IDEF0. Wikipedia]
The example "Design elements - IDEF0 diagram" is included in the IDEF0 Diagrams solution from the Software Development area of ConceptDraw Solution Park.
IDEF0 symbols
Flowchart design. Flowchart symbols, shapes, stencils and icons


The Best Tool for Business Process Modeling

Cross Functional Flowchart Symbols

ERD Symbols and Meanings


Business Process Flowchart Symbols

Process Flowchart


IDEF0 Diagram

Flowchart Components

Data Flow Diagram Symbols. DFD Library

Integration Definition

Seating Arrangement

Types of Flowcharts


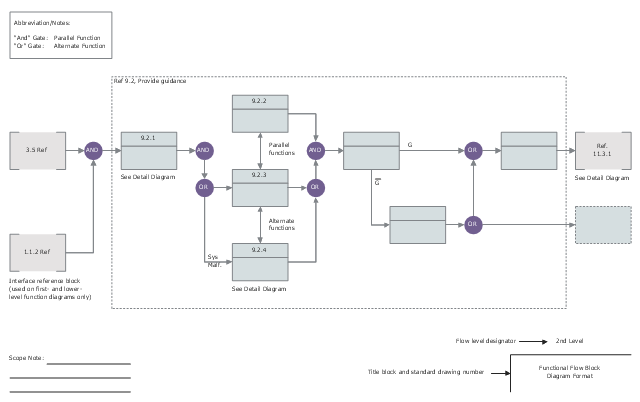
This functional flow block diagram sample was designed on the base of Wikimedia Commons file: Functional Flow Block Diagram Format.jpg.
"Image extracted from Systems Engineering Fundamentals. Defense Acquisition University Press, 2001."
[commons.wikimedia.org/ wiki/ File:Functional_ Flow_ Block_ Diagram_ Format.jpg]
The FFBD example "Functional flow block diagram" was designed using ConceptDraw PRO software extended with Сlassic Business Process Modeling solution from Business Processes area of ConceptDraw Solution Park.
Business process modeling diagram
Structured Systems Analysis and Design Method. SSADM with ConceptDraw DIAGRAM

- IDEF0 Diagram | IDEF0 Flowchart Symbols | IDEF0 Visio ...
- Integration Definition | IDEF0 Visio | IDEF | Functional Modeling In ...
- What Is The Function Of The Input Output Symbol
- Cross Functional Flowchart Symbols | Best Flowchart Software and ...
- IDEF0 diagram template | SysML block definition diagram - Function ...
- Cardinality Notation Symbol And Function
- How to Create an IDEF0 Diagram for an Application Development ...
- Basic Flowchart Symbols and Meaning | Flowchart Components ...
- Block Diagrams | How to Create a Functional Flow Block Diagram ...
- Accounting Flowchart Symbols | Flowchart design. Flowchart ...
- Basic Flowchart Symbols and Meaning | Flowchart Components ...
- Flowchart Definition | Basic Flowchart Symbols and Meaning | Types ...
- Flow Chart Symbols | Basic Flowchart Symbols and Meaning ...
- SysML block definition diagram - Function Breakdown model | Event ...
- Function hall floor plan | Sine function | Design elements ...
- IDEF0 Diagram
- IDEF0 Flowchart Symbols | Flowchart on Bank. Flowchart Examples ...
- IDEF0 standard with ConceptDraw DIAGRAM | How to Create an ...
- IDEF0 diagram template | Process Flowchart | Functional Flow Block ...
- IDEF0 standard with ConceptDraw PRO | IDEF0 Diagram | IDEF0 ...