Functional Flow Block Diagram

IDEF0 Visio

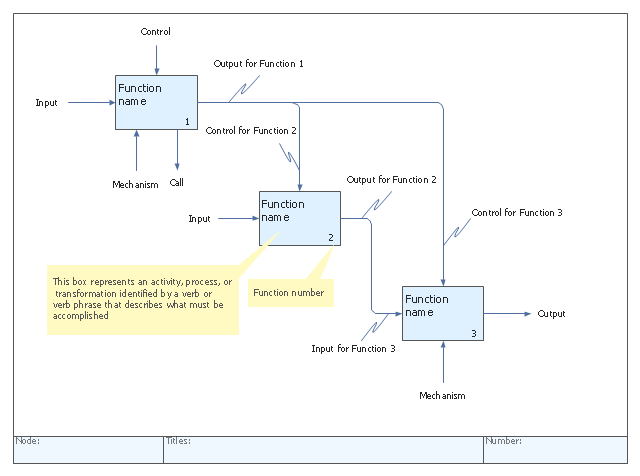
"IDEF0, a compound acronym (Icam DEFinition for Function Modeling, where 'ICAM' is an acronym for Integrated Computer Aided Manufacturing) is a function modeling methodology for describing manufacturing functions, which offers a functional modeling language for the analysis, development, reengineering, and integration of information systems; business processes; or software engineering analysis.
IDEF0 is part of the IDEF family of modeling languages in the field of software engineering, and is built on the functional modeling language Structured Analysis and Design Technique (SADT). ...
FIPS PUB 183 "Integration Definition for Function Modeling (IDEF0)," was withdrawn as a Federal Standard (in favor of OPEN Specifications and Standards) September 2, 2008, as cited in "The Federal Register", Volume 73, page 51276 (73FR/ 51276). ...
IDEF0, used to produce a "function model". A function model is a structured representation of the functions, activities or processes within the modeled system or subject area." [IDEF0. Wikipedia]
The template "IDEF0 diagram" is included in the IDEF0 Diagrams solution from the Software Development area of ConceptDraw Solution Park.
IDEF0 template
HelpDesk
How to Create a Functional Flow Block Diagram

Functional Block Diagram

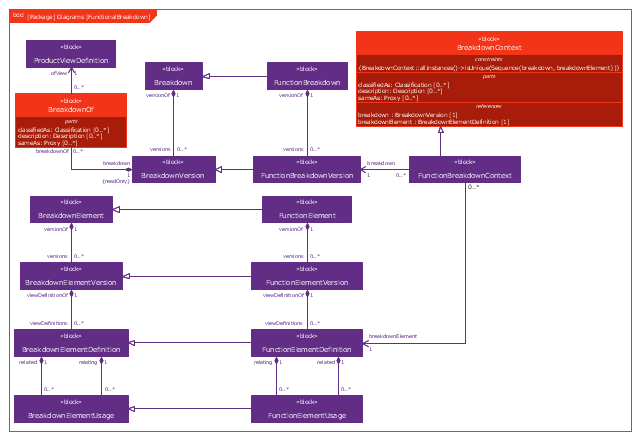
This example was drawn on the base of figure 1 on the webpage "Template: OASIS:FunctionalBreakdownStructure" from the OASIS website.
"The FunctionalBreakdownStructure template describes how to represent a relationship between a FunctionalElementDefinition and another FunctionalElementDefinition that is a constituent.
The SysML Block Definition diagram in Figure 1 shows how a functional breakdown is represented in the PLCS PSM."
[docs.oasis-open.org/ plcs/ plcslib/ v1.0/ csprd01/ data/ contexts/ OASIS/ templates/ FunctionalBreakdownStructure/ template.html]
"A block definition diagram is based on the UML class diagram, with restrictions and extensions as defined by SysML." [omg.org/ spec/ SysML/ 1.3/ PDF]
The example "SysML block definition diagram - Function Breakdown model" was drawn using the ConceptDraw PRO diagramming and vector drawing software extended with the SysML solution from the Software Development area of ConceptDraw Solution Park.
Example of SysML BDD
 Event-driven Process Chain Diagrams
Event-Driven Process Chain Diagrams solution extends ConceptDraw DIAGRAM functionality with event driven process chain templates, samples of EPC engineering and modeling the business processes, and a vector shape library for drawing the EPC diagrams and EPC flowcharts of any complexity. It is one of EPC IT solutions that assist the marketing experts, business specialists, engineers, educators and researchers in resources planning and improving the business processes using the EPC flowchart or EPC diagram. Use the EPC solutions tools to construct the chain of events and functions, to illustrate the structure of a business process control flow, to describe people and tasks for execution the business processes, to identify the inefficient businesses processes and measures required to make them efficient.
Horizontal Cross Functional Flowchart

HelpDesk
How to Create an IDEF0 Diagram for an Application Development

Cross-Functional Flowchart


Cross Functional Flowchart Symbols

 IDEF Business Process Diagrams
Use the IDEF Business Process Diagrams solution to create effective database designs and object-oriented designs, following the integration definition methodology.
IDEF0 Diagram

Flowchart Components

HelpDesk
Event-driven Process Chain (EPC) Diagram Software
 Diagram Software *")
The Best Tool for Business Process Modeling

JSD - Jackson system development

Process Flowchart


Interactive Voice Response Network Diagram


Flowchart design. Flowchart symbols, shapes, stencils and icons


- IDEF0 diagram template | SysML block definition diagram - Function ...
- IDEF0 diagram template | How to Create an IDEF0 Diagram for an ...
- IDEF0 Diagram | IDEF0 Flowchart Symbols | IDEF0 Visio ...
- Integration Definition | IDEF0 Visio | IDEF | Functional Modeling In ...
- IDEF0 diagram template | Software Diagram Templates | IDEF0 ...
- IDEF0 diagram template | SysML block definition diagram - Function ...
- Block Diagrams | How to Create a Functional Flow Block Diagram ...
- SysML block definition diagram - Function Breakdown model | Event ...
- Business Function Diagram
- SysML block definition diagram - Function Breakdown model | Event ...
- IDEF0 standard with ConceptDraw PRO | IDEF0 diagram template ...
- IDEF0 Diagram | IDEF0 Diagrams | IDEF0 diagram template | Idef0 ...
- QFD matrix - Template | QFD diagram - Template | Quality function ...
- IDEF0 standard with ConceptDraw PRO | IDEF0 Diagram | IDEF0 ...
- How to Create an IDEF0 Diagram for an Application Development ...
- How to Create an IDEF0 Diagram for an Application Development ...
- How To Draw Functional Decomposition Diagram
- Cross- Functional Process Map Template | Chemical Engineering ...
- Cross- Functional Flowcharts | Cross- Functional Process Map ...