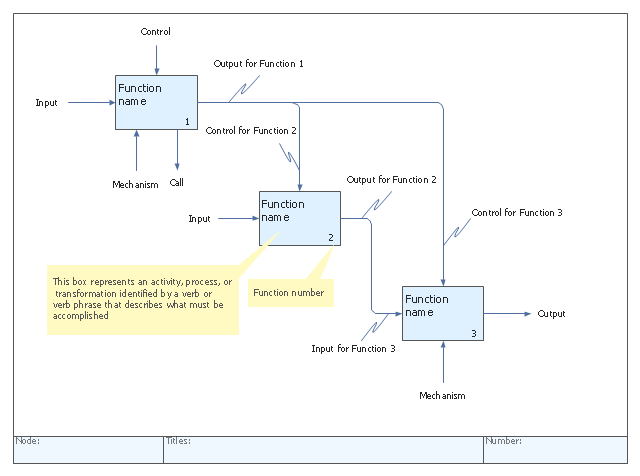
"IDEF0, a compound acronym (Icam DEFinition for Function Modeling, where 'ICAM' is an acronym for Integrated Computer Aided Manufacturing) is a function modeling methodology for describing manufacturing functions, which offers a functional modeling language for the analysis, development, reengineering, and integration of information systems; business processes; or software engineering analysis.
IDEF0 is part of the IDEF family of modeling languages in the field of software engineering, and is built on the functional modeling language Structured Analysis and Design Technique (SADT). ...
FIPS PUB 183 "Integration Definition for Function Modeling (IDEF0)," was withdrawn as a Federal Standard (in favor of OPEN Specifications and Standards) September 2, 2008, as cited in "The Federal Register", Volume 73, page 51276 (73FR/ 51276). ...
IDEF0, used to produce a "function model". A function model is a structured representation of the functions, activities or processes within the modeled system or subject area." [IDEF0. Wikipedia]
The template "IDEF0 diagram" is included in the IDEF0 Diagrams solution from the Software Development area of ConceptDraw Solution Park.
IDEF0 template
This example was drawn on the base of figure 1 on the webpage "Template: OASIS:FunctionalBreakdownStructure" from the OASIS website.
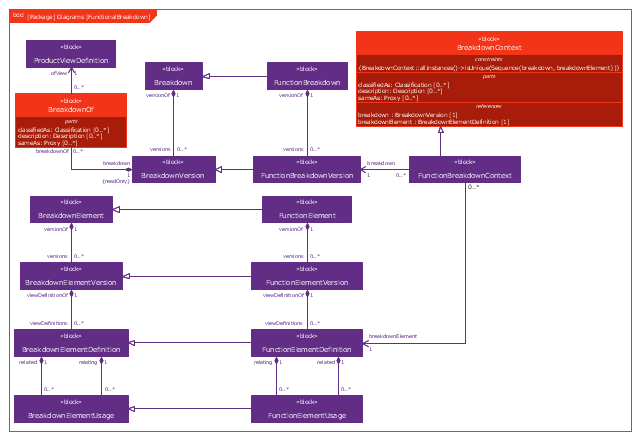
"The FunctionalBreakdownStructure template describes how to represent a relationship between a FunctionalElementDefinition and another FunctionalElementDefinition that is a constituent.
The SysML Block Definition diagram in Figure 1 shows how a functional breakdown is represented in the PLCS PSM."
[docs.oasis-open.org/ plcs/ plcslib/ v1.0/ csprd01/ data/ contexts/ OASIS/ templates/ FunctionalBreakdownStructure/ template.html]
"A block definition diagram is based on the UML class diagram, with restrictions and extensions as defined by SysML." [omg.org/ spec/ SysML/ 1.3/ PDF]
The example "SysML block definition diagram - Function Breakdown model" was drawn using the ConceptDraw PRO diagramming and vector drawing software extended with the SysML solution from the Software Development area of ConceptDraw Solution Park.
Example of SysML BDD
Process Flowchart


Flowchart Software


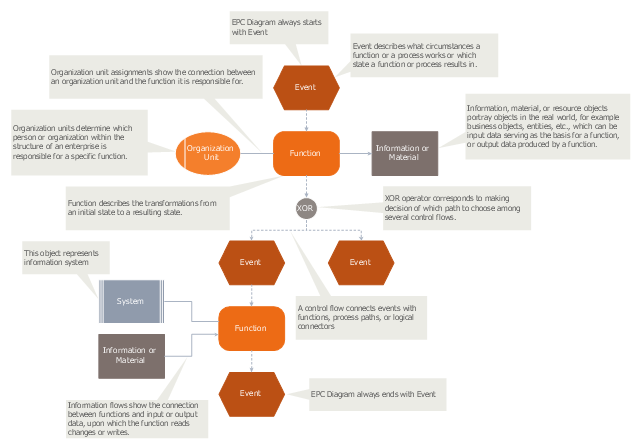
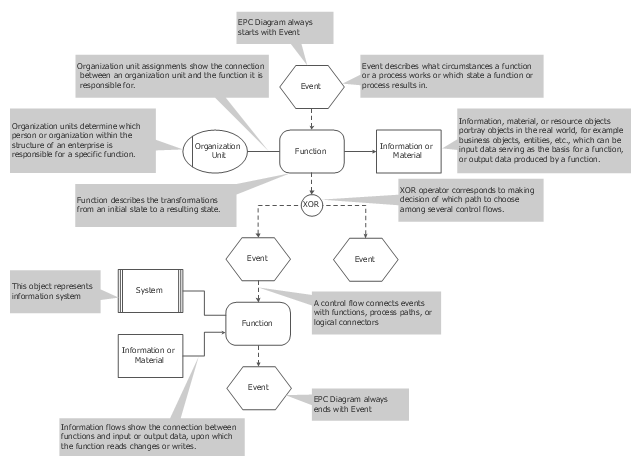
"An Event-driven Process Chain (EPC) is a type of flowchart used for business process modelling. Event-driven Process Chains can be used for configuring an enterprise resource planning (ERP) implementation, and for business process improvement. ...
Businesses use Event-driven Process Chain diagrams to lay out business process work flows, originally in conjunction with SAP R/ 3 modeling, but now more widely. It is used by many companies for modeling, analyzing, and redesigning business processes. The Event-driven Process Chain method was developed within the framework of Architecture of Integrated Information Systems (ARIS). As such it forms the core technique for modeling in ARIS, which serves to link the different views in the so-called control view." [Event-driven process chain. Wikipedia]
The event-driven process chain (EPC) diagram template for the ConceptDraw PRO diagramming and vector drawing software is included in the Event-driven Process Chain Diagrams solution from the Business Processes area of ConceptDraw Solution Park.
EPC diagram template
Matrices

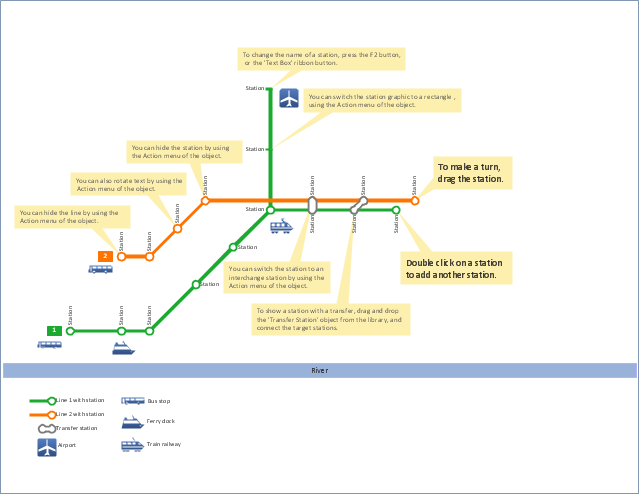
"A transit map is a topological map in the form of a schematic diagram used to illustrate the routes and stations within a public transport system - whether this be bus lines, tramways, rapid transit, commuter rail or ferry routes. The main components are color coded lines to indicate each line or service, with named icons to indicate stations or stops.
Transit maps can be found in the transit vehicles, at the platforms or in printed timetables. Their primary function is to help users to efficiently use the public transport system, including which stations function as interchange between lines. Unlike conventional maps, transit maps are usually not geographically accurate - instead they use straight lines and fixed angles, and often illustrate a fixed distance between stations, compressing those in the outer area of the system and expanding those close to the center." [Transit map. Wikipedia]
This transit map template for the ConceptDraw PRO diagramming and vector drawing software is included in the Metro Map solution from the Maps area of ConceptDraw Solution Park.
www.conceptdraw.com/ solution-park/ maps-metro-map
Transit map
 Management
This solution extends ConceptDraw PRO v9 and ConceptDraw MINDMAP v7 with Management Diagrams and Mind Maps (decision making, scheduling, thinking ideas, problem solving, business planning, company organizing, SWOT analysis, preparing and holding meetings
Basic Flowchart Symbols and Meaning

Use this event-driven process chain diagram template to design your EPC flowcharts in ConceptDraw PRO diagramming and vector drawing software.
"An Event-driven Process Chain (EPC) is a type of flowchart used for business process modelling. Event-driven Process Chains can be used for configuring an enterprise resource planning (ERP) implementation, and for business process improvement. ...
Businesses use Event-driven Process Chain diagrams to lay out business process work flows, originally in conjunction with SAP R/ 3 modeling, but now more widely. It is used by many companies for modeling, analyzing, and redesigning business processes. The Event-driven Process Chain method was developed within the framework of Architecture of Integrated Information Systems (ARIS). As such it forms the core technique for modeling in ARIS, which serves to link the different views in the so-called control view." [Event-driven process chain. Wikipedia]
The event-driven process chain flowchart template "EPC diagram" is included in the Basic EPC solution from the Business Processes area of ConceptDraw Solution Park.
Template
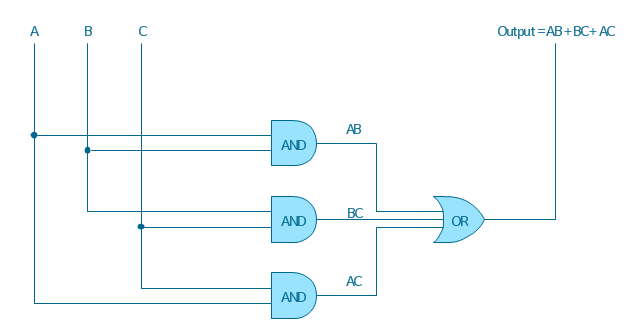
"A logic gate is an idealized or physical device implementing a Boolean function, that is, it performs a logical operation on one or more logical inputs, and produces a single logical output. Depending on the context, the term may refer to an ideal logic gate, one that has for instance zero rise time and unlimited fan-out, or it may refer to a non-ideal physical device...
Logic gates are primarily implemented using diodes or transistors acting as electronic switches, but can also be constructed using electromagnetic relays (relay logic), fluidic logic, pneumatic logic, optics, molecules, or even mechanical elements. With amplification, logic gates can be cascaded in the same way that Boolean functions can be composed, allowing the construction of a physical model of all of Boolean logic, and therefore, all of the algorithms and mathematics that can be described with Boolean logic.
Logic circuits include such devices as multiplexers, registers, arithmetic logic units (ALUs), and computer memory, all the way up through complete microprocessors, which may contain more than 100 million gates. In practice, the gates are made from field-effect transistors (FETs), particularly MOSFETs (metal–oxide–semiconductor field-effect transistors).
Compound logic gates AND-OR-Invert (AOI) and OR-AND-Invert (OAI) are often employed in circuit design because their construction using MOSFETs is simpler and more efficient than the sum of the individual gates.
In reversible logic, Toffoli gates are used." [Logic gate. Wikipedia]
The logic gate diagram template for the ConceptDraw PRO diagramming and vector drawing software is included in the Electrical Engineering solution from the Engineering area of ConceptDraw Solution Park.
Logic gate diagram
Cross-Functional Flowchart


Matrix Organization Structure

Flowchart Components


- Function Model Diagram Template
- Time Function Mapping Template
- Time Function Map Template Excel
- Quality function deployment chart - Template | Competitor Analysis ...
- Quality function deployment chart - Template
- Function Model Diagram Templates
- Quality Function Deployment Templates
- Quality function deployment chart - Template | Deployment Chart ...
- Quality function deployment chart - Handheld projector | Quality ...
- Deployment chart - Template | Quality function deployment chart ...
- Business Function Diagram
- Business Function Charts Templates
- Design elements - Building core | Home floor plan template ...
- IDEF0 diagram template | IDEF0 standard with ConceptDraw PRO ...
- IDEF0 diagram template | Cross-Functional Flowcharts | Business ...
- Mathematical Diagrams | Venn Diagram Template for Word ...
- Wedding Reception Floor Plan Template
- Process Flowchart | Cross-Functional Process Map Template | Cross ...
- Cross-Functional Flowchart | Quality Function Deployment Example ...
- Matrices | Management | Competitor Analysis | Qfd Chart Template