 Management
This solution extends ConceptDraw PRO v9 and ConceptDraw MINDMAP v7 with Management Diagrams and Mind Maps (decision making, scheduling, thinking ideas, problem solving, business planning, company organizing, SWOT analysis, preparing and holding meetings
Matrices

Business Tools Perceptual Mapping

Deployment Chart Software

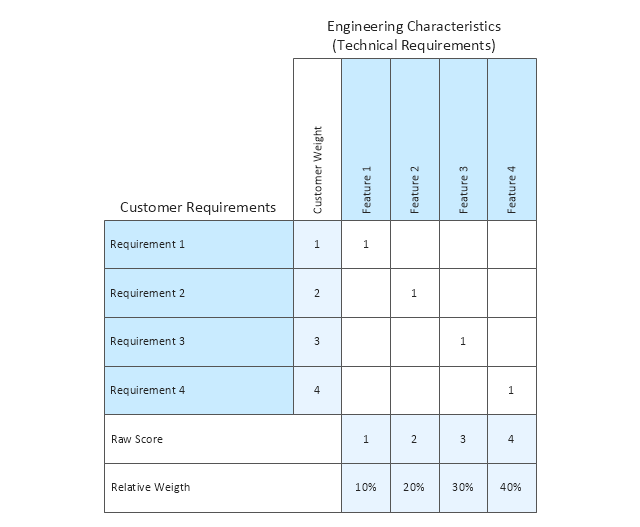
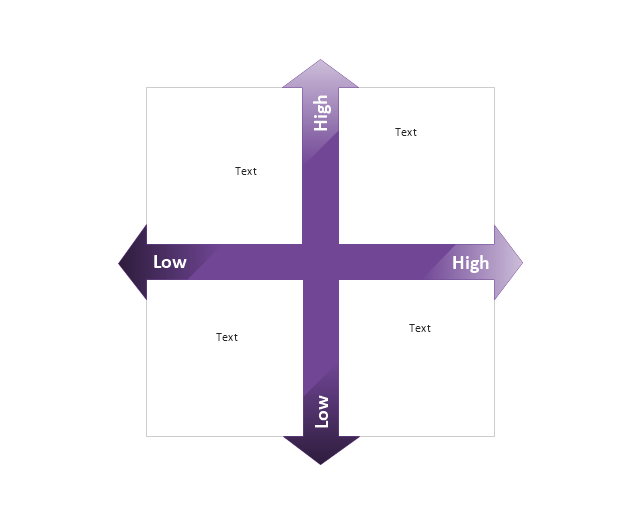
The vector stencils library "Matrices" contains 10 templates of marketing matrix diagrams and charts.
Use these templates to create your marketing matrices in the ConceptDraw PRO diagramming and vector drawing software extended with the Matrices solution from the Marketing area of ConceptDraw Solution Park.
Use these templates to create your marketing matrices in the ConceptDraw PRO diagramming and vector drawing software extended with the Matrices solution from the Marketing area of ConceptDraw Solution Park.
Quality function deployment matrix
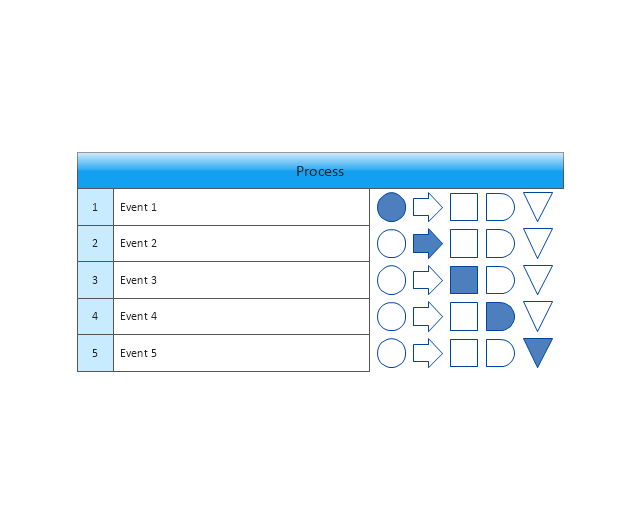
Flow process chart
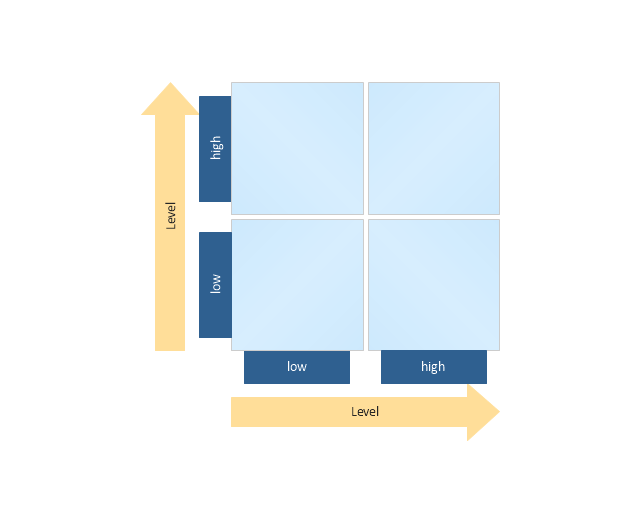
Four-quadrant matrix
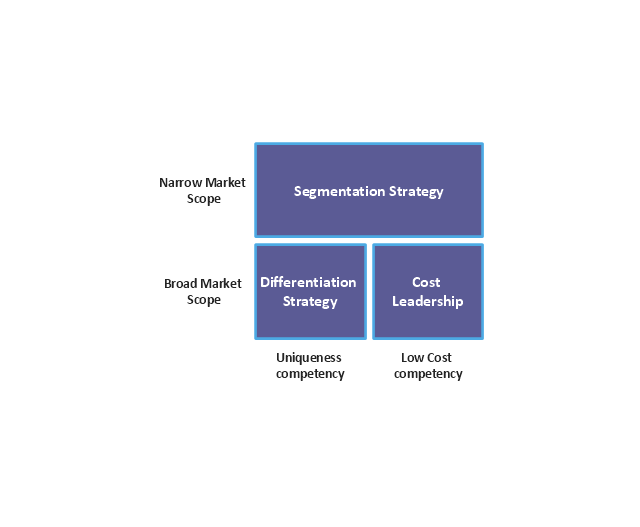
Competitive strategies matrix
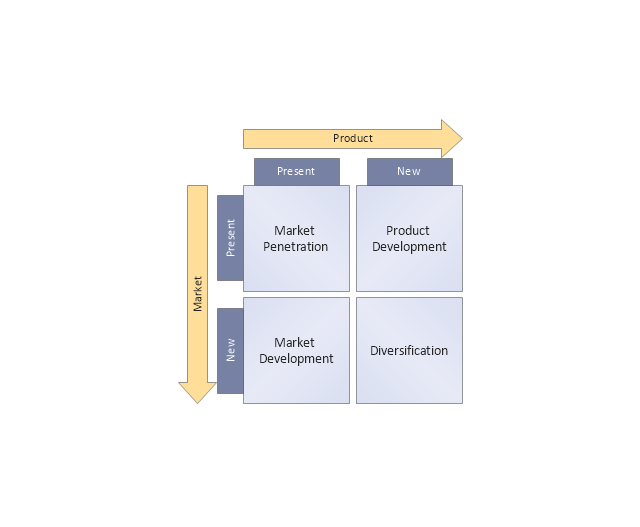
Ansoff matrix
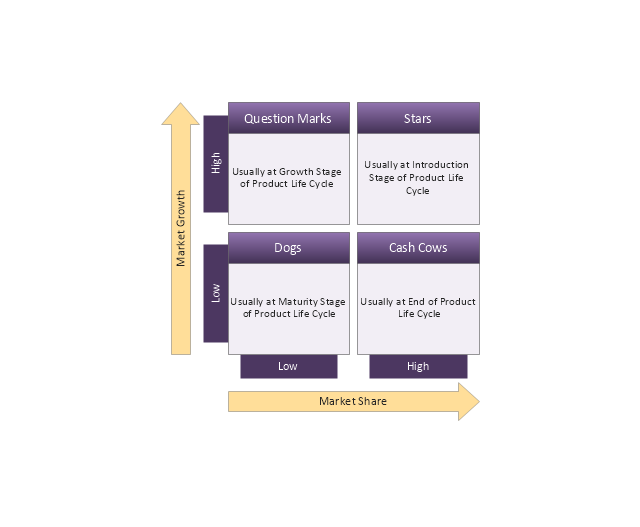
BCG matrix
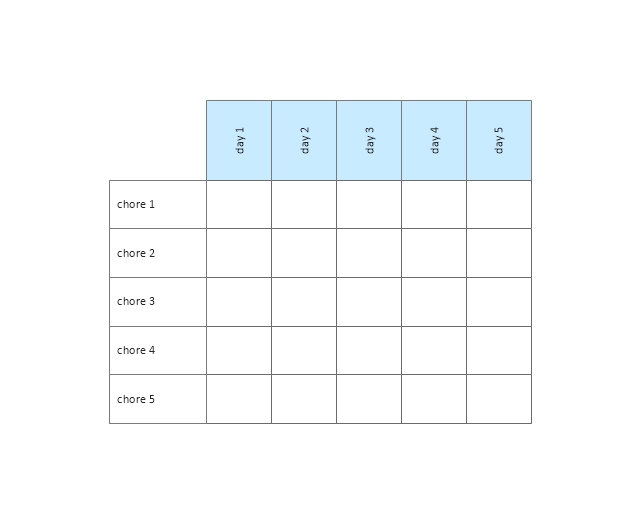
Chore chart
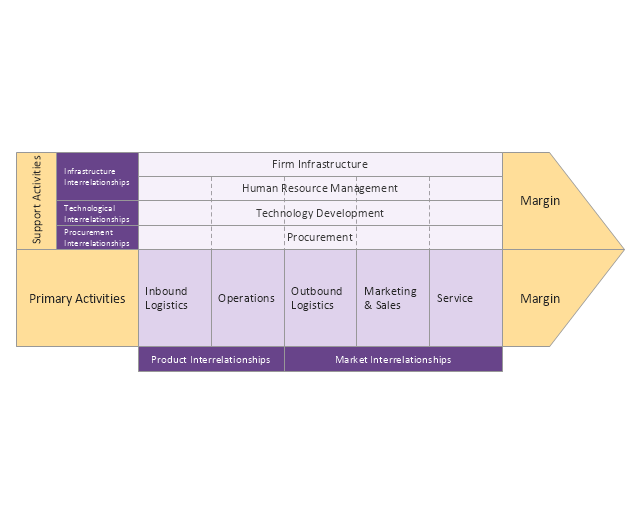
Porter's value chain diagram
Positioning map
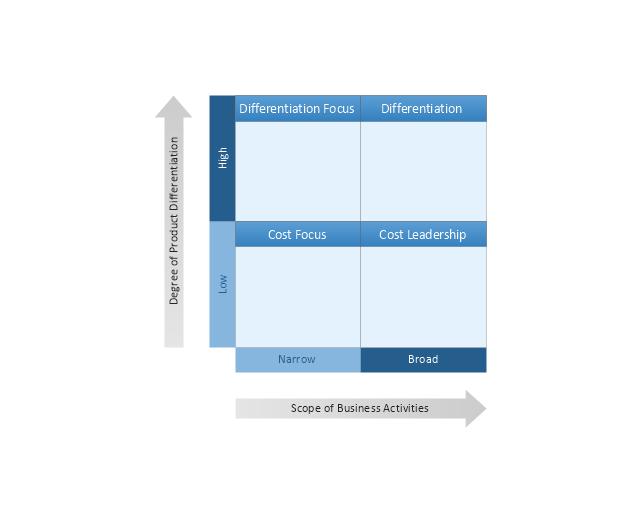
Porter's generic strategies matrix
Competitor Analysis

Growth-Share Matrix Software

Cross-Functional Flowchart


 Matrices
This solution extends ConceptDraw PRO software with samples, templates and library of design elements for drawing the business matrix diagrams.
Types of Flowcharts


 Cross-Functional Flowcharts
Cross-functional flowcharts are powerful and useful tool for visualizing and analyzing complex business processes which requires involvement of multiple people, teams or even departments. They let clearly represent a sequence of the process steps, the order of operations, relationships between processes and responsible functional units (such as departments or positions).
Quality Control Chart Software — ISO Flowcharting

How To use Switches in Network Diagram


 Business Process Mapping
The Business Process Mapping solution for ConceptDraw PRO is for users involved in process mapping and creating SIPOC diagrams.
Block Diagram Software

- Quality Function Deployment Templates
- Quality function deployment chart - Template | Deployment Chart ...
- Quality function deployment chart - Handheld projector | Quality ...
- Quality function deployment chart - Template | Competitor Analysis ...
- Deployment chart - Template | Quality function deployment chart ...
- Cross-Functional Flowchart | Quality Function Deployment Example ...
- Explain Quality Function Deployment With Diagram
- Quality function deployment chart - Handheld projector | Competitor ...
- Deployment Chart Software | Deployment chart - Template | Trading ...
- House of Quality Matrix Software | Matrices - Vector stencils library ...
- Quality Function Deployment Diagram Hd Images
- Qfd Process With New Chart And Flow Diagram
- Network Architecture | Competitor Analysis | Matrices | Qfd Software
- A Functional Deployment Process Diagram
- Quality Matrix Template
- Examples Of Quality Function Management With Images Or Diagrams
- Function hall floor plan | Design elements - Trigonometric functions ...
- Chore chart - Template | Deployment chart - Template | Deployment ...
- Four-quadrant matrix - Template | Customer types matrix | Matrices ...