Deployment Chart Software

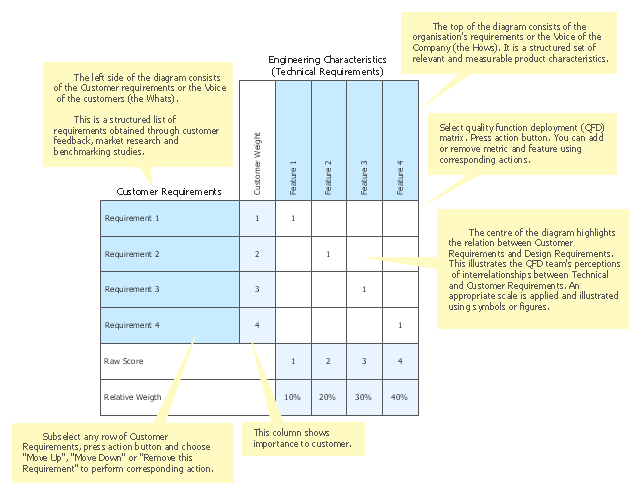
"Quality function deployment (QFD) is a “method to transform user demands into design quality, to deploy the functions forming quality, and to deploy methods for achieving the design quality into subsystems and component parts, and ultimately to specific elements of the manufacturing process.”, as described by Dr. Yoji Akao, ... when the author combined his work in quality assurance and quality control points with function deployment used in value engineering.
QFD is designed to help planners focus on characteristics of a new or existing product or service from the viewpoints of market segments, company, or technology-development needs. The technique yields charts and matrices.
QFD helps transform customer needs (the voice of the customer [VOC]) into engineering characteristics (and appropriate test methods) for a product or service, prioritizing each product or service characteristic while simultaneously setting development targets for product or service." [Quality function deployment. Wikipedia]
This quality function deployment (QFD) matrix chart example was created using the ConceptDraw PRO diagramming and vector drawing software extended with the Matrices solution from the Marketing area of ConceptDraw Solution Park.
QFD
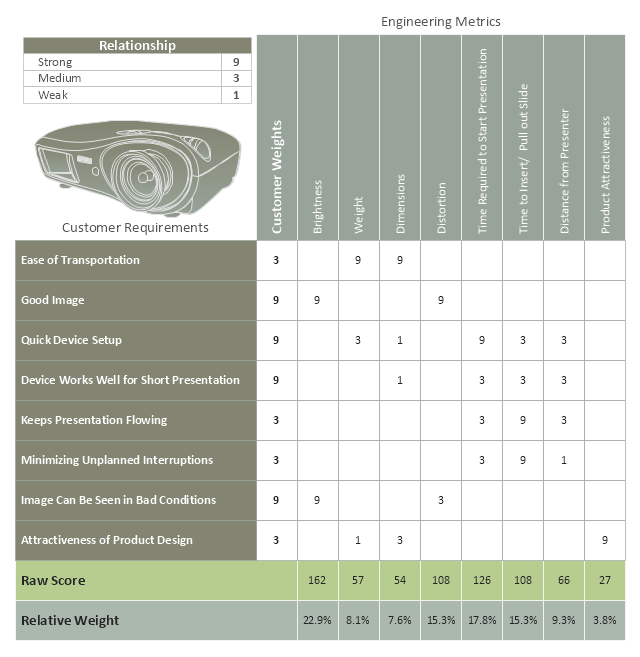
QFD transforms customer needs (the voice of the customer) into engineering characteristics (and appropriate test methods) of a product (service), prioritizing each product (service) characteristic while simultaneously setting development targets for product (service) development.
The template "Quality function deployment chart" for the ConceptDraw PRO diagramming and vector drawing software is included in the Matrices solution from the Marketing area of ConceptDraw Solution Park.
The template "Quality function deployment chart" for the ConceptDraw PRO diagramming and vector drawing software is included in the Matrices solution from the Marketing area of ConceptDraw Solution Park.
Quality function deployment chart template
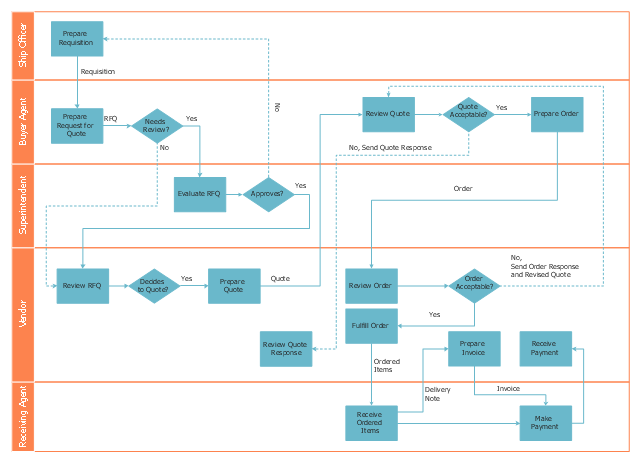
Cross-Functional Flowchart


This deployment flow chart sample shows the trading process flow.
"Trade, also called goods exchange economy, is to transfer the ownership of goods from one person or entity to another by getting something in exchange from the buyer. Trade is sometimes loosely called commerce or financial transaction or barter. A network that allows trade is called a market. ...
Modern traders ... generally negotiate through a medium of exchange, such as money. As a result, buying can be separated from selling, or earning. ...
Retail trade consists of the sale of goods or merchandise from a very fixed location, such as a department store, boutique or kiosk, or by mail, in small or individual lots for direct consumption by the purchaser. Wholesale trade is defined as the sale of goods that are sold merchandise to retailers, to industrial, commercial, institutional, or other professional business users, or to other wholesalers and related subordinated services." [Trade. Wikipedia]
The swim lane diagram example "Deployment flowchart - Trading process diagram" was created using the ConceptDraw PRO diagramming and vector drawing software extended with the Cross-Functional Flowcharts solution from the Business Processes area of ConceptDraw Solution Park.
Swim lane diagram
Basic Audit Flowchart. Flowchart Examples

UML Component Diagram


Feature Comparison Chart Software

Build a Flowchart Quickly With AutoConnect

Cross-Functional Flowcharts in ConceptDraw

Best Diagramming


Matrices

UML Flowchart Symbols

UML Deployment Diagram

QFD | Quality Function Deployment Diagram

Wireless Network with ConceptDraw DIAGRAM

UML Use Case Diagram Example - Estate Agency

How to draw a Cross-Functional Flowchart

 Matrices
This solution extends ConceptDraw DIAGRAM software with samples, templates and library of design elements for drawing the business matrix diagrams.
- Cross-Functional Flowchart | Cross-functional horizontal flowchart ...
- Matrices | Deployment Or Matrix Flow Chart Example
- Deployment chart - Template
- Quality function deployment chart - Handheld projector | Quality ...
- Quality function deployment chart - Template | Deployment Chart ...
- Deployment chart - Template | Deployment chart - Template ...
- UML Deployment Diagram . Diagramming Software for Design UML ...
- Quality function deployment chart - Template
- Deployment chart - Template | Quality function deployment chart ...
- UML Diagram Visio | UML Deployment Diagram . Diagramming ...
- Quality function deployment chart - Handheld projector | Competitor ...
- Business diagrams & Org Charts with ConceptDraw DIAGRAM ...
- QFD matrix - Template | QFD diagram - Template | Quality function ...
- UML Deployment Diagram . Diagramming Software for Design UML ...
- UML Deployment Diagram Example - ATM System UML diagrams ...
- Quality function deployment chart - Handheld projector | RCP ...
- Software Deployment Process Diagram
- Interaction Overview Diagram | UML Deployment Diagram Example ...
- Quality function deployment chart - Handheld projector | QFD matrix ...