"Quality function deployment (QFD) is a “method to transform user demands into design quality, to deploy the functions forming quality, and to deploy methods for achieving the design quality into subsystems and component parts, and ultimately to specific elements of the manufacturing process.”, as described by Dr. Yoji Akao, ... when the author combined his work in quality assurance and quality control points with function deployment used in value engineering.
QFD is designed to help planners focus on characteristics of a new or existing product or service from the viewpoints of market segments, company, or technology-development needs. The technique yields charts and matrices.
QFD helps transform customer needs (the voice of the customer [VOC]) into engineering characteristics (and appropriate test methods) for a product or service, prioritizing each product or service characteristic while simultaneously setting development targets for product or service." [Quality function deployment. Wikipedia]
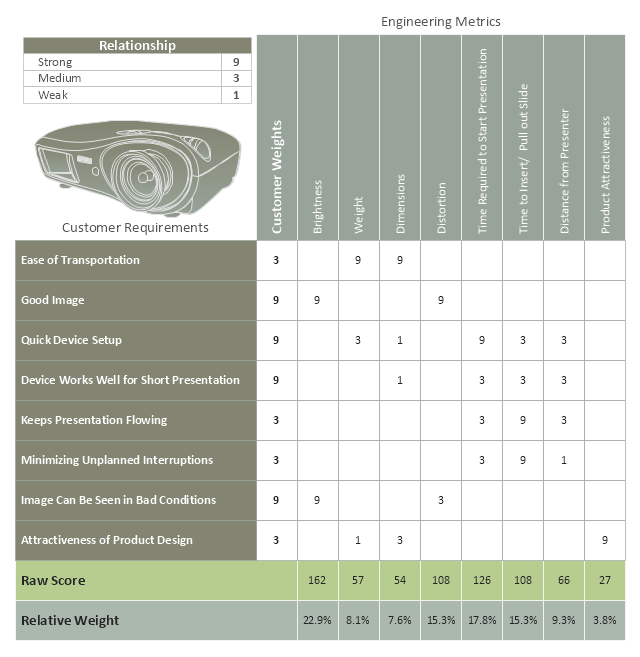
This quality function deployment (QFD) matrix chart example was created using the ConceptDraw PRO diagramming and vector drawing software extended with the Matrices solution from the Marketing area of ConceptDraw Solution Park.
QFD is designed to help planners focus on characteristics of a new or existing product or service from the viewpoints of market segments, company, or technology-development needs. The technique yields charts and matrices.
QFD helps transform customer needs (the voice of the customer [VOC]) into engineering characteristics (and appropriate test methods) for a product or service, prioritizing each product or service characteristic while simultaneously setting development targets for product or service." [Quality function deployment. Wikipedia]
This quality function deployment (QFD) matrix chart example was created using the ConceptDraw PRO diagramming and vector drawing software extended with the Matrices solution from the Marketing area of ConceptDraw Solution Park.
QFD
Use this quality function deployment matrix template to design your house of quality diagrams and QFD matrices.
"Quality function deployment (QFD) is a method developed in Japan beginning in 1966 to help transform the voice of the customer [VOC] into engineering characteristics for a product." [Quality function deployment. Wikipedia]
The quality function deployment matrix template "QFD matrix" was designed using ConceptDraw PRO software extended with House of Quality solution from Quality area of ConceptDraw PRO Solution Park.
Quality function deployment
This house of quality matrix sample was designed on the base of the Wikimedia Commons file: Casa de la calidad QFD.png.
[commons.wikimedia.org/ wiki/ File:A1_ House_ of_ Quality.png]
This file is made available under the Creative Commons CC0 1.0 Universal Public Domain Dedication. [creativecommons.org/ publicdomain/ zero/ 1.0/ deed.en]
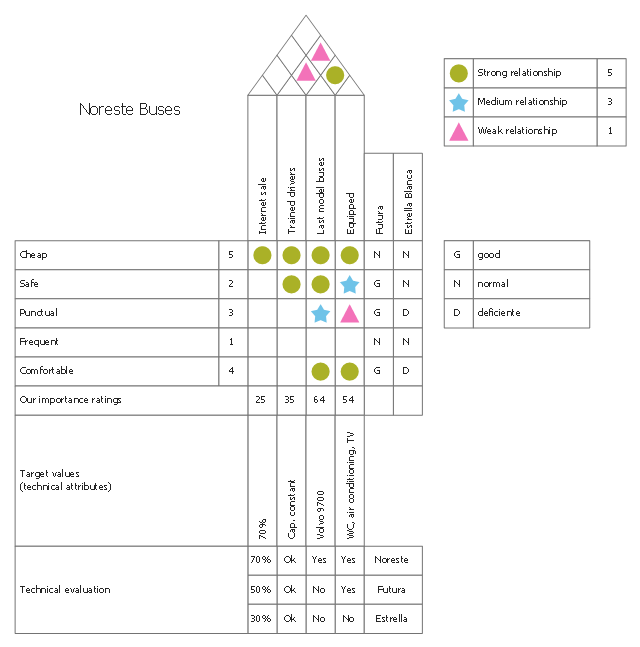
"The house of quality, a part of QFD, identifies and classifies customer desires, identifies the importance of those desires, identifies engineering characteristics which may be relevant to those desires, correlates the two, allows for verification of those correlations, and then assigns objectives and priorities for the system requirements. This process can be applied at any system composition level (e.g. system, subsystem, or component) in the design of a product, and can allow for assessment of different abstractions of a system." [Quality function deployment. Wikipedia]
The HOQ example "House of quality of buses" was designed using ConceptDraw PRO software extended with House of Quality solution from Quality area of ConceptDraw PRO Solution Park.
[commons.wikimedia.org/ wiki/ File:A1_ House_ of_ Quality.png]
This file is made available under the Creative Commons CC0 1.0 Universal Public Domain Dedication. [creativecommons.org/ publicdomain/ zero/ 1.0/ deed.en]
"The house of quality, a part of QFD, identifies and classifies customer desires, identifies the importance of those desires, identifies engineering characteristics which may be relevant to those desires, correlates the two, allows for verification of those correlations, and then assigns objectives and priorities for the system requirements. This process can be applied at any system composition level (e.g. system, subsystem, or component) in the design of a product, and can allow for assessment of different abstractions of a system." [Quality function deployment. Wikipedia]
The HOQ example "House of quality of buses" was designed using ConceptDraw PRO software extended with House of Quality solution from Quality area of ConceptDraw PRO Solution Park.
HOQ matrix
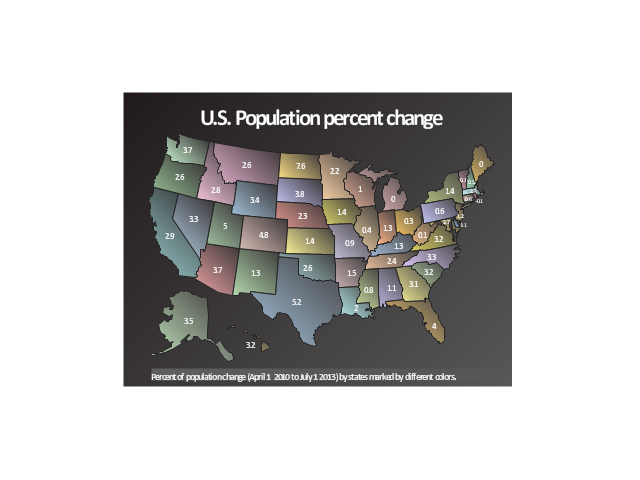
This sample was drawn on the base of the spatial dashboard "U.S. Population percent change" from the United States Census Bureau website.
[quickfacts.census.gov/ qfd/ index.html]
"As of March 20, 2014, the United States has a total population of 317 million, making it the third-most populous country in the world. It is very urbanized, with 82% residing in cities and suburbs as of 2011 (the worldwide urban rate is 52%). California and Texas are the most populous states, as the mean center of U.S. population has consistently shifted westward and southward. New York City is the most populous city in the United States.
The total fertility rate in the United States estimated for 2012 is 1.88 children per woman, which is below the replacement fertility rate of approximately 2.1. Compared to other Western countries, in 2011, U.S. fertility rate was lower than that of France (2.02) and the United Kingdom (1.97). However, U.S. population growth is among the highest in industrialized countries, because the differences in fertility rates are less than the differences in immigration levels, which are higher in the U.S. The United States Census Bureau shows population increase of 0.75% for the twelve-month period ending in July 2012. Though high by industrialized country standards, this is below the world average annual rate of 1.1%.
There were over 158.6 million females in the United States in 2009. The number of males was 151.4 million. At age 85 and older, there were more than twice as many women as men. People under 20 years of age made up over a quarter of the U.S. population (27.3%), and people age 65 and over made up one-eighth (12.8%) in 2009. The national median age was 36.8 years." [Demographics of the United States. Wikipedia]
The geospatial dashboard example "U.S. Population, percent change, 2010 to 2013" was created using the ConceptDraw PRO diagramming and vector drawing software extended with the Spatial Dashboard solution from the area "What is a Dashboard" of ConceptDraw Solution Park.
Geospatial dashboard
- Quality function deployment chart - Handheld projector | RCP ...
- Quality function deployment chart - Handheld projector | Quality ...
- Qfd
- Quality function deployment chart - Handheld projector | Competitor ...
- Block diagram - Gap model of service quality | Parasuraman Wikipedia
- Logistic Dashboard | Total Logistics Costs by Countries - Template ...
- Deployment Chart Software | Deployment chart - Template | UML ...
- Communication Gap Wikipedia
- Project tasks dashboard | How To Prioritize Customers Sales Call ...
- Percentage Pie Chart. Pie Chart Examples | Percentage of the top 1 ...