"Dimensions of service quality.
A customer's expectation of a particular service is determined by factors such as recommendations, personal needs and past experiences. The expected service and the perceived service sometimes may not be equal, thus leaving a gap. The service quality model or the ‘GAP model’ developed by a group of authors- Parasuraman, Zeithaml and Berry at Texas and North Carolina in 1985 , highlights the main requirements for delivering high service quality. It identifies five ‘gaps’ that cause unsuccessful delivery. Customers generally have a tendency to compare the service they 'experience' with the service they 'expect' . If the experience does not match the expectation , there arises a gap. Ten determinants that may influence the appearance of a gap were described by Parasuraman, Zeithaml and Berry. in the SERVQUAL model: reliability, responsiveness, competence, access, courtesy, communication, credibility, security, understanding the customer and tangibles.
Later, the determinants were reduced to five: tangibles; reliability; responsiveness; service assurance and empathy in the so called RATER model." [Service quality. Wikipedia]
The block diagram example "Gap model of service quality" was created using the ConceptDraw PRO diagramming and vector drawing software extended with the Block Diagrams solution from the area "What is a Diagram" of ConceptDraw Solution Park.
Block diagram

Block Diagram Creator

Work Order Process Flowchart. Business Process Mapping Examples

Campus Area Networks (CAN). Computer and Network Examples


"In computer networking, cloud computing is computing that involves a large number of computers connected through a communication network such as the Internet, similar to utility computing. ...
Network-based services, which appear to be provided by real server hardware, and are in fact served up by virtual hardware, simulated by software running on one or more real machines are often called cloud computing. Such virtual servers do not physically exist and can therefore be moved around and scaled up or down on the fly without affecting the end user, somewhat like a cloud becoming larger or smaller without being a physical object. ...
Typically, the seller has actual energy-consuming servers which host products and services from a remote location, so end-users don't have to; they can simply log on to the network without installing anything. The major models of cloud computing service are known as software as a service, platform as a service, and infrastructure as a service. These cloud services may be offered in a public, private or hybrid network. Google, Amazon,leadsquared.com, Oracle Cloud, Salesforce, Zoho, Access2MyPC, and Microsoft Azure are some well-known cloud vendors." [Cloud computing. Wikipedia]
The AWS architecture diagram example "2-Tier Auto-scalable Web Application Architecture in 1 AZ" was created using the ConceptDraw PRO diagramming and vector drawing software extended with the AWS Architecture Diagrams solution from the Computer and Networks area of ConceptDraw Solution Park.
AWS architecture diagram
.png--diagram-flowchart-example.png)
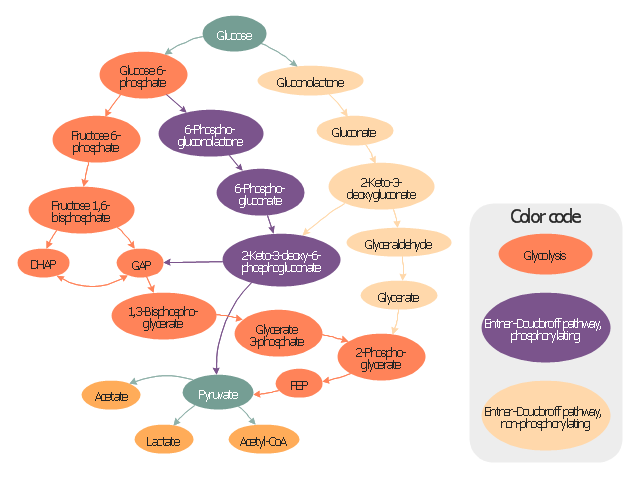
"Carbohydrate catabolism is the breakdown of carbohydrates into smaller units. Carbohydrates literally undergo combustion to retrieve the large amounts of energy in their bonds. Energy is secured by mitochondria in the form of ATP.
There are several different types of carbohydrates: polysaccharides (e.g., starch, amylopectin, glycogen, cellulose), monosaccharides (e.g., glucose, galactose, fructose, ribose) and the disaccharides (e.g., maltose, lactose).
Glucose reacts with oxygen in the following redox reaction, C6H12O6 + 6O2 → 6CO2 + 6H2O, the carbon dioxide and water is a waste product and the chemical reaction is exothermic.
The breakdown of glucose into energy in the form of molecules of ATP is therefore one of the most important biochemical pathways found in living organisms." [Carbohydrate catabolism. Wikipedia]
This glucose catabolism pathways map shows glycolysis by orange color, Entner-Doudoroff phosphorylating pathway by green color, Entner-Doudoroff non-phosphorylating pathway by Yellow color.
This methabolic pathway map was redesigned from Wikimedia file: Glucose catabolism pathways.svg. [commons.wikimedia.org/ wiki/ File:Glucose_ catabolism_ pathways.svg]
The biochemical diagram example "Glucose catabolism pathways map" was created using the ConceptDraw PRO diagramming and vector drawing software extended with the Biology solution from the Science and Education area of ConceptDraw Solution Park.
Catabolic pathway map
What is SWOT Analysis?

 SYSML
SYSML
The SysML solution helps to present diagrams using Systems Modeling Language; a perfect tool for system engineering.
- Electrical Symbols, Electrical Diagram Symbols | Gap Model Wiki
- Block diagram - Gap model of service quality | Model Based ...
- Block diagram - Gap model of service quality | Parasuraman Wikipedia
- Gaps Model Of Service Quality Wiki
- Cross Functional Flowchart Wikipedia
- Block diagram - Gap model of service quality | Service-goods ...
- Business Process Wiki
- Wiki Business Process
- Business Process Improvement Wiki