Process Flowchart


DFD Library System

Context Diagram Template

This template shows the Context Diagram. It was created in ConceptDraw PRO diagramming and vector drawing software using the Block Diagrams Solution from the “Diagrams” area of ConceptDraw Solution Park. The context diagram graphically identifies the system. external factors, and relations between them. It’s a high level view of the system. The context diagrams are widely used in software engineering and systems engineering for designing the systems that process the information.
Create Block Diagram

Product Proposal Template

 IDEF0 Diagrams
IDEF0 Diagrams visualize system models using the Integration Definition for Function Modeling (IDEF) methodology. Use them for analysis, development and integration of information and software systems, and business process modelling.
HelpDesk
How to Draw a Block Diagram in ConceptDraw PRO

SSADM Diagram

 Pyramid Diagrams
Pyramid Diagrams solution extends ConceptDraw PRO software with templates, samples and library of vector stencils for drawing the marketing pyramid diagrams.
Types of Flowcharts


HelpDesk
How To Convert a Block Diagram to Adobe PDF

Types of Flowchart - Overview

IDEF0 Diagram

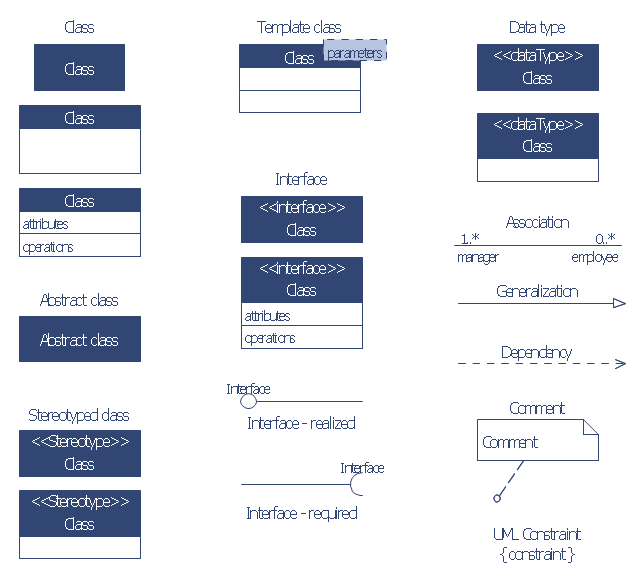
The vector stencils library "Bank UML class diagram" contains 19 shapes for drawing UML class diagrams.
Use it for object-oriented modeling of your bank information system.
"The class diagram is the main building block of object oriented modelling. It is used both for general conceptual modelling of the systematics of the application, and for detailed modelling translating the models into programming code. Class diagrams can also be used for data modeling. The classes in a class diagram represent both the main objects, interactions in the application and the classes to be programmed.
In the diagram, classes are represented with boxes which contain three parts:
* The top part contains the name of the class. It is printed in bold and centered, and the first letter is capitalized.
* The middle part contains the attributes of the class. They are left-aligned and the first letter is lowercase.
* The bottom part contains the methods the class can execute. They are also left-aligned and the first letter is lowercase.
In the design of a system, a number of classes are identified and grouped together in a class diagram which helps to determine the static relations between those objects. With detailed modelling, the classes of the conceptual design are often split into a number of subclasses." [Class diagram. Wikipedia]
This example of UML class diagram symbols for the ConceptDraw PRO diagramming and vector drawing software is included in the ATM UML Diagrams solution from the Software Development area of ConceptDraw Solution Park.
UML class diagram symbols
 Audit Flowcharts
Audit flowcharts solution extends ConceptDraw PRO software with templates, samples and library of vector stencils for drawing the audit and fiscal flow charts.
Basic Flowchart Symbols and Meaning


 IDEF Business Process Diagrams
Use the IDEF Business Process Diagrams solution to create effective database designs and object-oriented designs, following the integration definition methodology.
 Telecommunication Network Diagrams
Telecommunication Network Diagrams solution extends ConceptDraw PRO software with samples, templates, and great collection of vector stencils to help the specialists in a field of networks and telecommunications, as well as other users to create Computer systems networking and Telecommunication network diagrams for various fields, to organize the work of call centers, to design the GPRS networks and GPS navigational systems, mobile, satellite and hybrid communication networks, to construct the mobile TV networks and wireless broadband networks.
- Block Diagrams | Create Block Diagram | Types of Flowcharts ...
- 5 level pyramid model diagram of information systems types ...
- How to Draw a Computer Network Diagrams | Marketing Diagrams ...
- Explain Information System With The Help Of Block Diagram
- Pyramid Diagram | Pyramid Chart Examples | Block diagram - Five ...
- Pyramid Diagram | Pyramid Diagram | 5 level pyramid model ...
- UML Diagram Types List | UML Diagram Types | Block diagram
- Context Diagram Template | DFD Library System | Data Flow ...
- Block diagram template
- Pyramid Diagram
- 3 Level pyramid model diagram - Information systems types
- Block diagram - Document management system architecture | Block ...
- 3 level pyramid model diagram of information systems types | 5 level ...
- How to Draw a Computer Network Diagrams | Block Diagrams ...
- Pyramid Diagram
- Software Development | Information Architecture | What Is ...
- 4 Level pyramid model diagram - Information systems types ...
- Block diagram - Document management system architecture | Types ...
- 4 Level pyramid model diagram - Information systems types ...
- 4 Level pyramid model diagram - Information systems types | Types ...