HelpDesk
How to Create a Bar Chart

The bar graph can be vertical or horizontal. This depends on the number of categories. There are many methods in which bar graph can be built and this makes it a very often used chart type. Usually, a bar chart is created so that the bars are placed vertically. Such an arrangement means that the bar's height value is proportional to the category value. Nevertheless, a bar chart can be also drawn horizontally. This means that the longer the bar, the bigger the category. Thus, a bar chart is a good way to present the relative values of different measured items. The ConceptDraw Bar Graphs solution allows you to draw a bar chart quickly using a vector library, containing the set of various bar charts objects.
How to Create a Bar Chart

Chart Software for Better Presentations

Graphs and Charts Area provide a wide collection of professional looking predesigned templates, samples and ready-to-use vector stencils that will help you to draw the charts and diagrams of various types: Pie Charts, Donut Charts, Line Charts, Column Charts, Bar Charts, Pyramids, Scatter Charts, Venn Diagrams, Spider Charts, Area Charts, Divided Bar Graphs.
Bar Diagrams for Problem Solving. Create space science bar charts with Bar Graphs Solution

Create bar graphs for visual solving your scientific problems and data comparison using the ConceptDraw DIAGRAM diagramming and vector drawing software extended with the Bar Graphs Solution from the Graphs and Charts area of ConceptDraw Solition Park.
Chart Maker for Presentations

The Best Drawing Program for Mac

HelpDesk
How to Create a Time Series Dashboard

HelpDesk
How to Connect a Live Object to a Text Data Source

Quality Control Chart Software — ISO Flowcharting

The quality control chart is a graphic that illustrates the accordance of processes or products to the intended specifications and degree of differences from them. Depending on what type of data you need analyze, there are used different types of quality control charts: X-bar charts, S charts, Np charts.
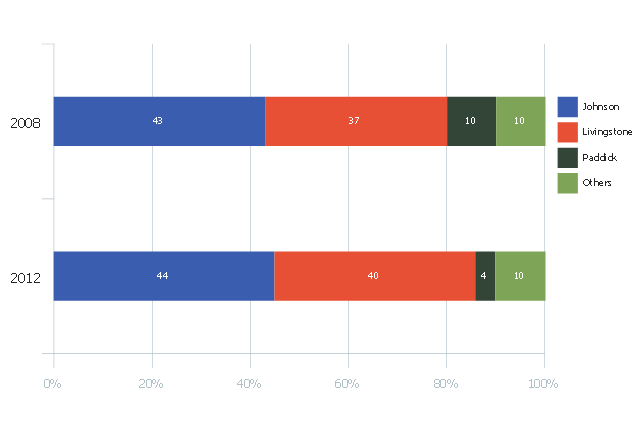
This divided bar diagram sample shows London election results in 2008 and 2012. It was drawn using data from the infographics "London Elections Results by Numbers" on the london.gov.uk website.
[data.london.gov.uk/ datastore/ package/ london-elections-results-2012-wards-boroughs-constituency]
"There are six types of elections in the United Kingdom: United Kingdom general elections, elections to devolved parliaments and assemblies, elections to the European Parliament, local elections, mayoral elections and Police and Crime Commissioner elections. Elections are held on Election Day, which is conventionally a Thursday. General elections do not have fixed dates, but must be called within five years of the opening of parliament following the last election. Other elections are held on fixed dates, though in the case of the devolved assemblies and parliaments early elections can occur in certain situations. Currently, six electoral systems are used: the single member plurality system (First Past the Post), the multi member plurality system, party list PR, the single transferable vote, the Additional Member System and the Supplementary Vote.
Elections are administered locally: in each lower-tier local authority, the actual polling procedure is run by the Returning Officer and the compiling and maintenance of the electoral roll by the Electoral Registration Officer (except in Northern Ireland, where the Electoral Office for Northern Ireland assumes both responsibilities). The Electoral Commission only sets standards for and issues guidelines to Returning Officers and Electoral Registration Officers, but is responsible for nationwide electoral administration (such as the registration of political parties and directing the administration of national referendums)." [Elections in the United Kingdom. Wikipedia]
The chart example "London election results" was created using the ConceptDraw PRO diagramming and vector drawing software extended with the Divided Bar Diagrams solution from the Graphs and Charts area of ConceptDraw Solution Park.
Divided bar chart
HelpDesk
How to Use ConceptDraw Sales Dashboard Solution

Basic Diagramming

Use Basic Diagramming solution to draw you own diagrams, charts and graphs for graphic communication, explanation of business and personal ideas and concepts, simple visual presentation of numerical data, complex structures, logical relations, step-by-step flows of actions or operations.

How to Create a Pie Chart

Line Chart Examples

Scatter Chart Examples

Use it to draw scatter graphs using ConceptDraw DIAGRAM diagramming and vector drawing software for illustrating your documents, presentations and websites.
 ConceptDraw Solution Park
ConceptDraw Solution Park collects graphic extensions, examples and learning materials
 Picture Graphs
Typically, a Picture Graph has very broad usage. They many times used successfully in marketing, management, and manufacturing. The Picture Graphs Solution extends the capabilities of ConceptDraw DIAGRAM with templates, samples, and a library of professionally developed vector stencils for designing Picture Graphs.
Picture Graph

HelpDesk
How to Draw a Histogram

- Bar Diagrams for Problem Solving. Create manufacturing and ...
- Double Bar Graph | Chart Maker for Presentations | Picture Graphs ...
- Double Bar Graph | Create Graphs and Charts | Design elements ...
- Cross-Functional Flowcharts | Types of Flowchart - Overview ...
- Types of Flowchart - Overview | Flow chart Example. Warehouse ...
- Flow chart Example. Warehouse Flowchart | Basic Flowchart ...
- How to Draw a Divided Bar Chart in ConceptDraw PRO | Divided ...
- Bar Chart Software
- Bar Chart Software | Bar Chart Examples | Bar chart template | _bar ...
- Bar Chart Examples
- Double-headed Cross Functional Flowchart | Double bar chart ...
- The Best Drawing Program for Mac | Bar Chart Software | Column ...
- Picture Graphs | Line Graphs | Bar Graphs | Graphs
- Pie Chart Examples | Bar Chart Examples | Flow Chart Diagram ...
- Bar Chart Software
- Bar Chart Examples
- Double bar graph template | Double bar chart - Changes in price ...
- Bar Chart Examples | Bar Chart Software | Bar Graphs | Simple Bar ...
- Bar Chart Examples | Bar Diagrams for Problem Solving. Create ...
- Histograms | Chart Examples | Bar Chart Examples | Histogram Visio
- ERD | Entity Relationship Diagrams, ERD Software for Mac and Win
- Flowchart | Basic Flowchart Symbols and Meaning
- Flowchart | Flowchart Design - Symbols, Shapes, Stencils and Icons
- Flowchart | Flow Chart Symbols
- Electrical | Electrical Drawing - Wiring and Circuits Schematics
- Flowchart | Common Flowchart Symbols
- Flowchart | Common Flowchart Symbols