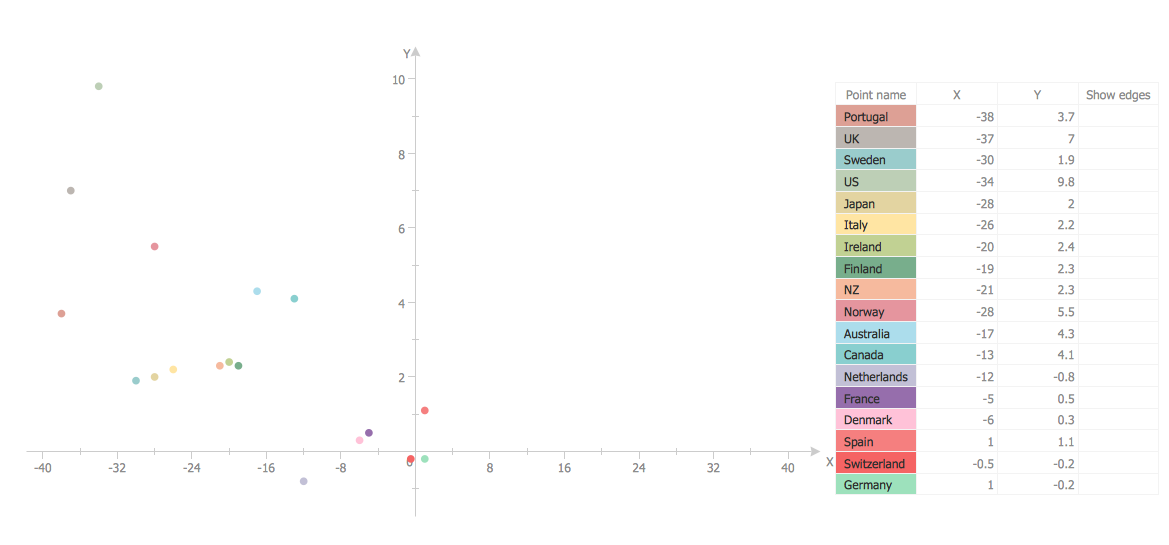
Scatter Plot

Scatter Plot Graph
Basic Diagramming


Basic Diagramming


Basic Diagramming

Use Basic Diagramming solution to draw you own diagrams, charts and graphs for graphic communication, explanation of business and personal ideas and concepts, simple visual presentation of numerical data, complex structures, logical relations, step-by-step flows of actions or operations.
The Best Drawing Program for Mac

Basic Diagramming

Best Vector Drawing Application for Mac OS X

Bubble Chart
Best Program to Make Diagrams

Best Diagramming Software for macOS

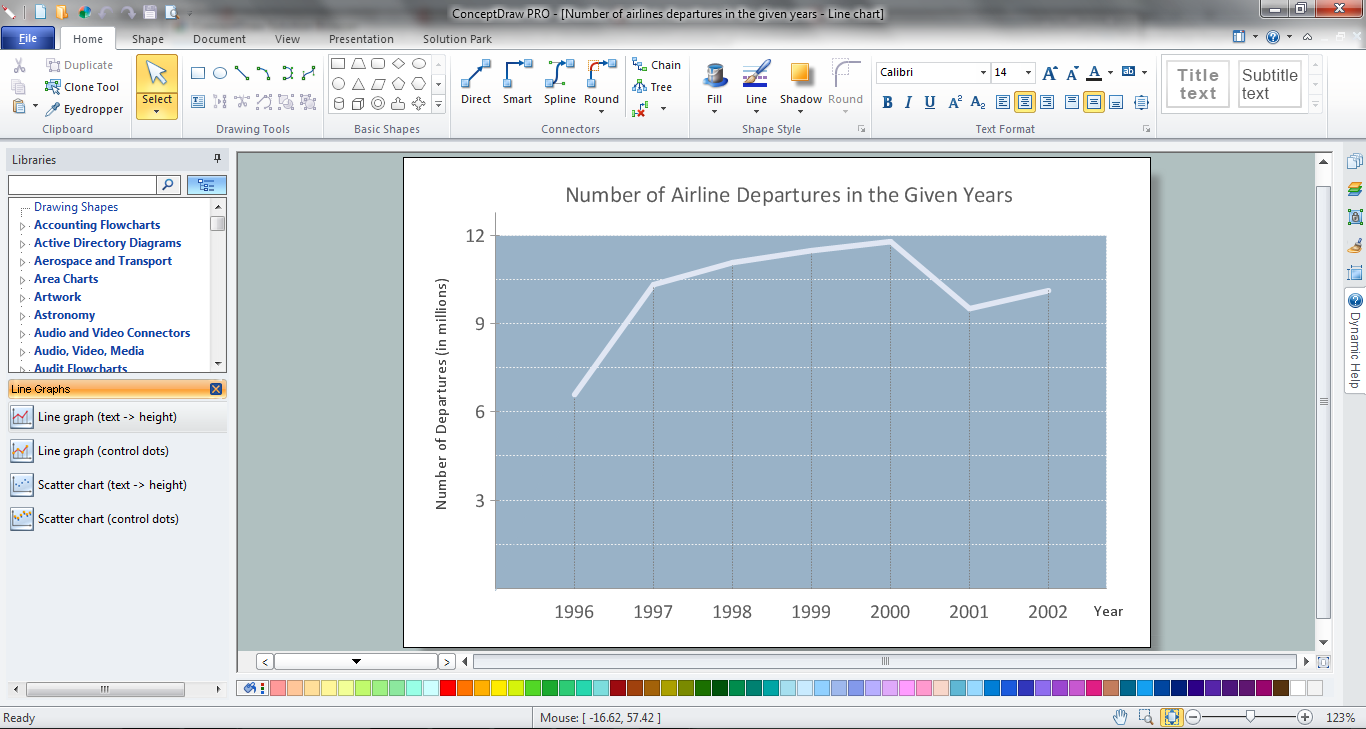
Line Chart
Best Diagramming

Line Graph

Spider Chart Template

Bar Chart Software

The Best Flowchart Software Available

ConceptDraw DIAGRAM vector diagramming and business graphics software enhanced with with templates, green and interactive flowchart makers, samples and stencil libraries from ConceptDraw Solution Park which all focused to help with drawing flowcharts, block diagrams, bar charts, histograms, pie charts, divided bar diagrams, line graphs, area charts, scatter plots, circular arrows diagrams, Venn diagrams, bubble diagrams, concept maps, and others.
 ConceptDraw Solution Park
ConceptDraw Solution Park collects graphic extensions, examples and learning materials
 macOS User Interface
macOS User Interface solution extends the ConceptDraw DIAGRAM functionality with powerful GUI software graphic design features and tools. It provides an extensive range of multifarious macOS Sierra user interface design examples, samples and templates, and wide variety of libraries, containing a lot of pre-designed vector objects of Mac Apps icons, buttons, dialogs, menu bars, indicators, pointers, controls, toolbars, menus, and other elements for fast and simple designing high standard user interfaces of any complexity for new macOS Sierra.
- Basic Diagramming | Best Diagramming Software for Mac | Radar ...
- Scatter Diagrams | Scatter Diagram | Blank Scatter Plot | Scatter ...
- Create Graphs and Charts | Chart Maker for Presentations | Sales ...
- Line Graph Charting Software | Scatter Chart Examples | Visual ...
- Scatter Chart Examples | Blank Scatter Plot | Scatter Chart Analysis ...
- The Best Drawing Program for Mac | Scatter Chart Examples | Line ...
- Scatter Diagram | Scatter Chart Examples | Design elements ...
- Scatter Chart Examples | Blank Scatter Plot | Line Chart Examples ...
- Scatter Chart Examples | Blank Scatter Plot | Design elements ...
- Scatter Chart Examples | Scatter Diagrams | Blank Scatter Plot ...
- Scatter Chart Examples | How to Create a Scatter Chart | Scatter ...
- Scatter chart - MENA's (Middle East and North Africa's) real GDP ...
- Polar Graph | Bubble diagrams in Landscape Design with ...
- Design elements - Correlation charts | Blank Scatter Plot ...
- Pie Chart Examples and Templates | Donut Chart Templates | Blank ...
- Double Bar Graph | Chart Maker for Presentations | Picture Graphs ...
- Blank Scatter Plot | Donut Chart Templates | Pie Chart Examples ...
- How To Create a Bubble Chart | Bubble diagrams in Landscape ...
- Spider Chart Template | Chart Maker for Presentations | Chart ...
- How To Create a Bubble Chart
- ERD | Entity Relationship Diagrams, ERD Software for Mac and Win
- Flowchart | Basic Flowchart Symbols and Meaning
- Flowchart | Flowchart Design - Symbols, Shapes, Stencils and Icons
- Flowchart | Flow Chart Symbols
- Electrical | Electrical Drawing - Wiring and Circuits Schematics
- Flowchart | Common Flowchart Symbols
- Flowchart | Common Flowchart Symbols