Create Graphs and Charts
Charting Software allows you to create diagrams, charts, graphs, flowcharts, and other business graphics. ConceptDraw PRO include simple shape drawing tools, examples, templates, and symbol libraries.Chart Maker for Presentations
Easy charting software comes with beautiful chart templates and examples. This makes it easy to create professional charts without prior experience.Sales Growth. Bar Graphs Example
This sample was created in ConceptDraw PRO diagramming and vector drawing software using the Bar Graphs Solution from Graphs and Charts area of ConceptDraw Solution Park. It is Bar Graphs example, Sales Growth example, Column Chart Example - Sales Report.Polar Graph
This sample shows the Polar Graph. The Polar Graph is a graph in the polar coordinate system in which the each point on the plane is defined by two values - the polar angle and the polar radius. The certain equations have very complex graphs in the Cartesian coordinates, but the application of the polar coordinate system allows usually produce the simple Polar Graphs for these equations.
 ConceptDraw Solution Park
ConceptDraw Solution Park collects graphic extensions, examples and learning materials
Step Area Graph
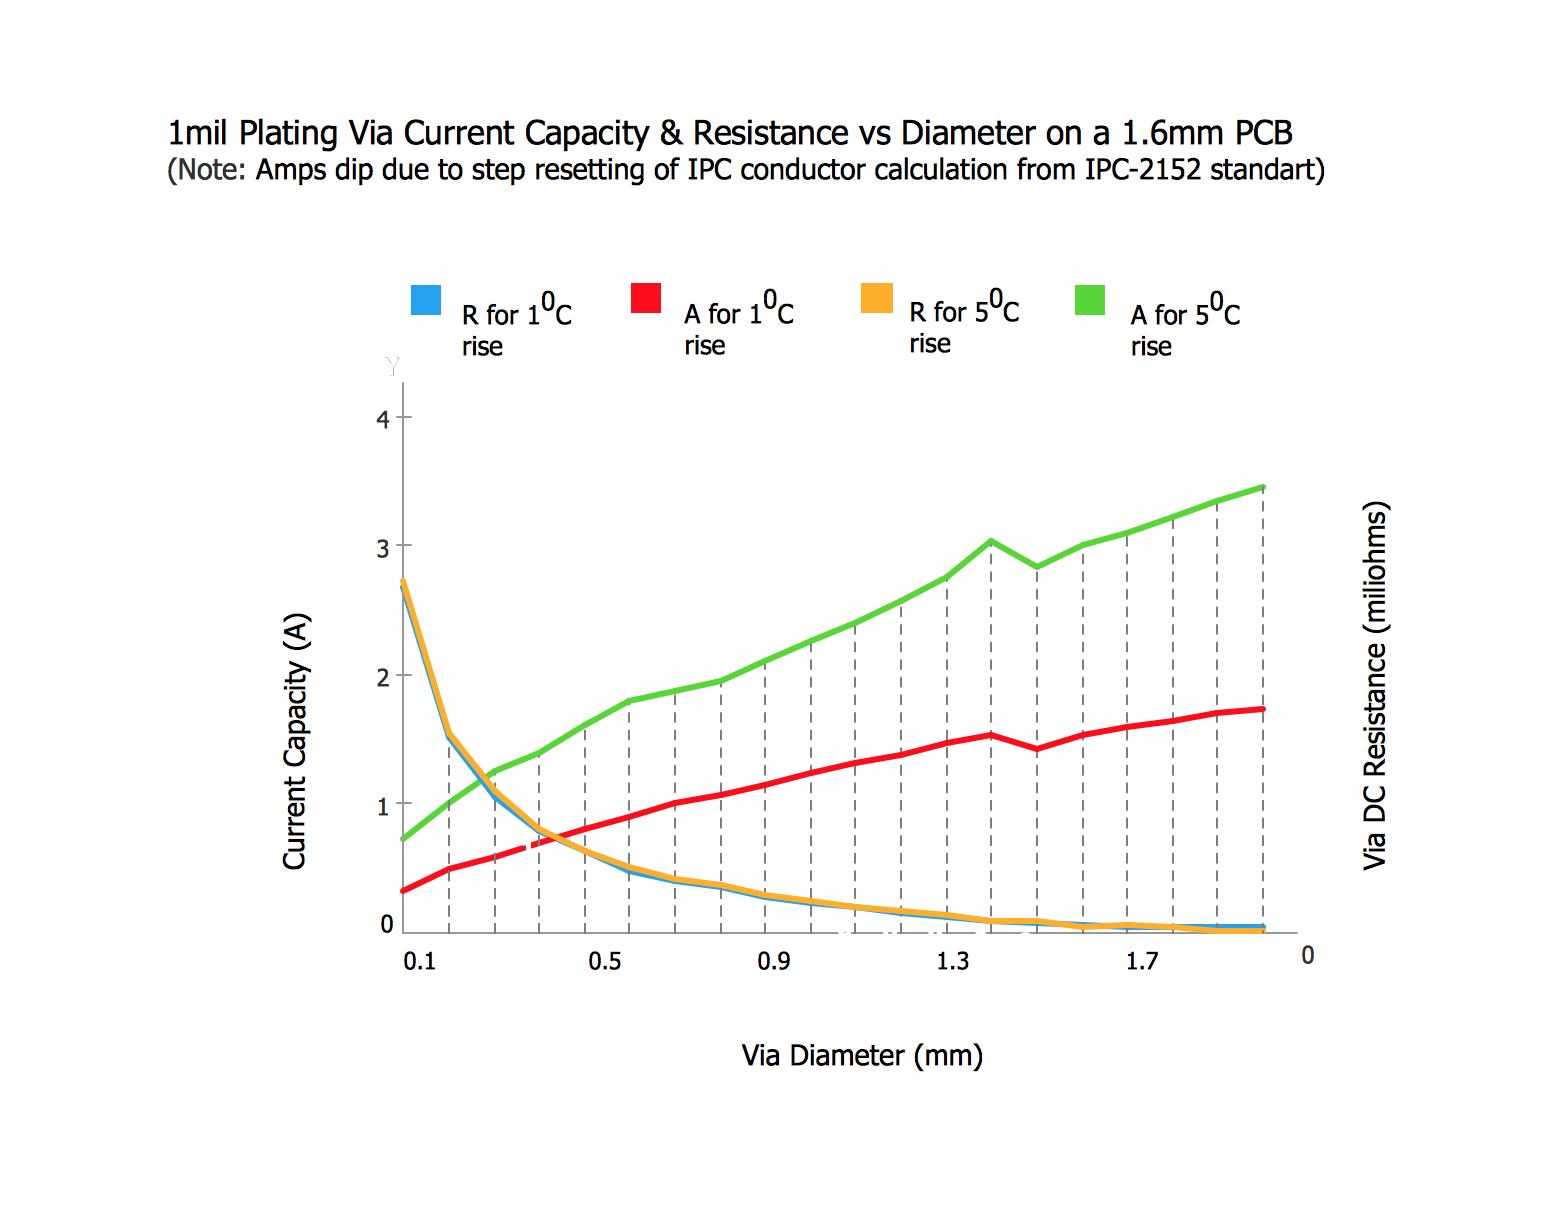
This sample shows the Step Area Graph of the PCB (Printed circuit board) Via current capacity and can be useful in electronics. It is displayed 1 mil plating Via current capacity and the resistance vs diameter on a 1.6 mm PCB. A via is an electrical connection between the layers in the electronical circuit that in PCB consists of two pads on the different electrically connected layers of the board.Line Chart Template for Word
This sample was created in ConceptDraw PRO diagramming and vector drawing software using the Line Graphs Solution from Graphs and Charts area of ConceptDraw Solution Park.This sample shows the Line Chart of annual percentage change. The Line Chart allows you to clearly see the changes of data over the time.
Bar Chart Template for Word
All these bar chart templates are included in the Bar Graphs solution.You can quickly rework these bar graph templates into your own charts by simply changing displayed data, title and legend texts.
Rainfall Bar Chart
This sample shows the Horizontal Bar Chart of the average monthly rainfalls.This sample was created in ConceptDraw PRO diagramming and vector drawing software using the Bar Graphs Solution from the Graphs and Charts area of ConceptDraw Solution Park.
Scatter Chart Analysis. Scatter Chart Example
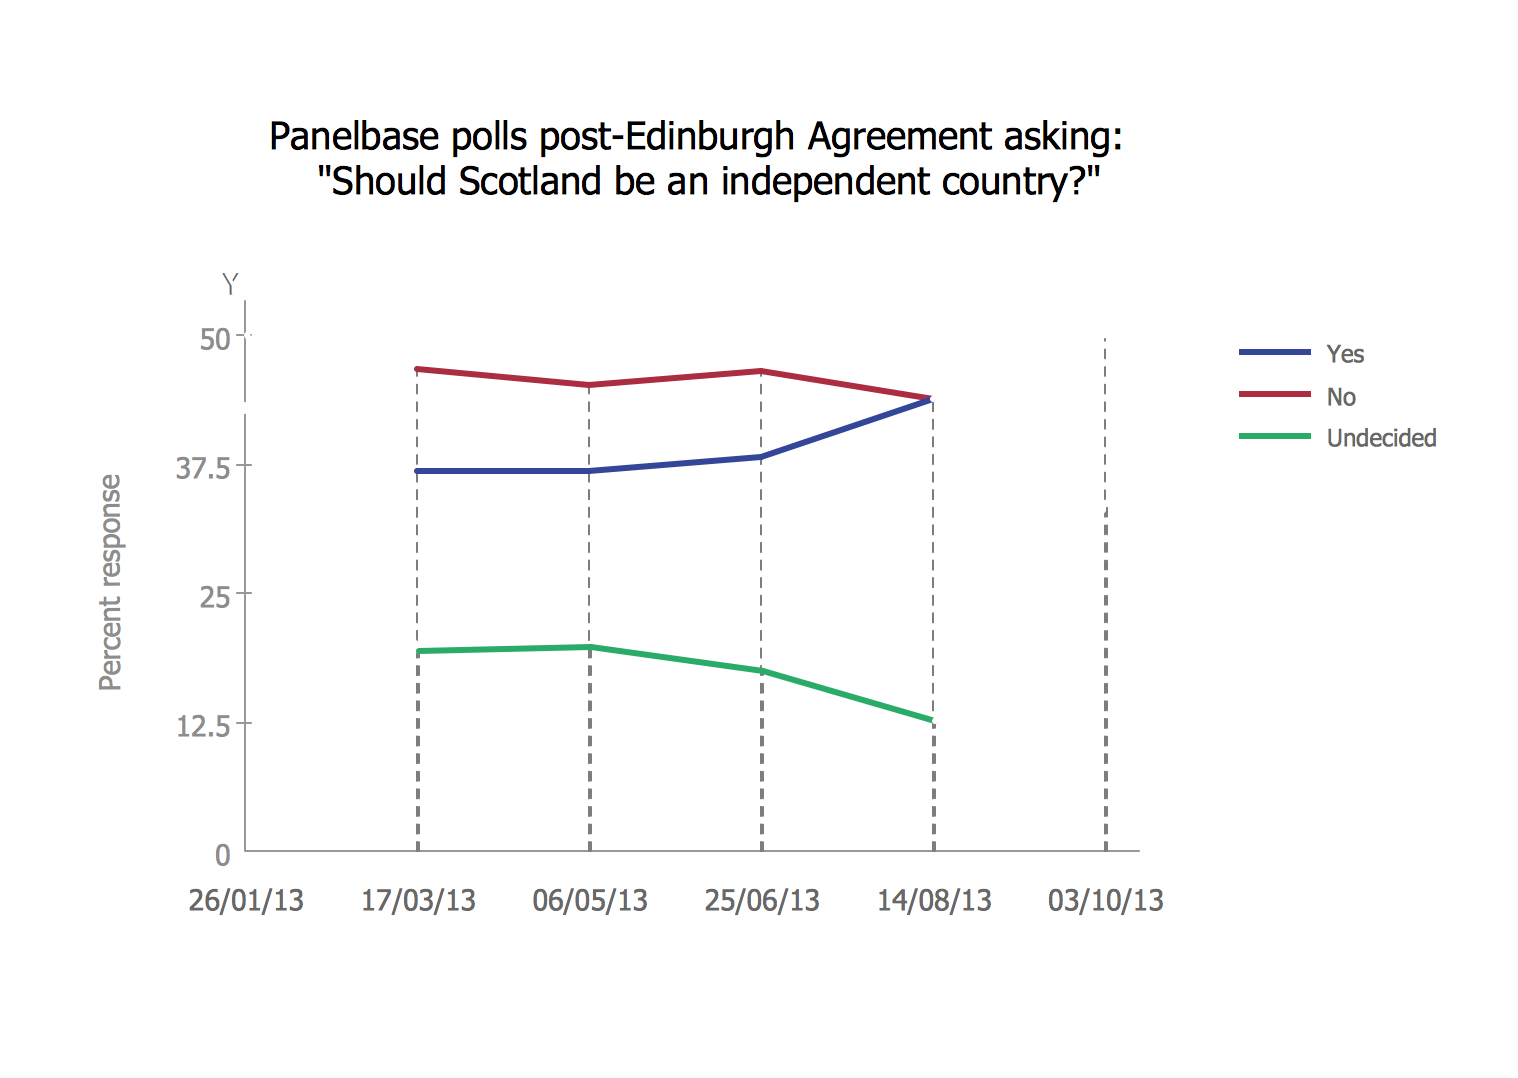
This sample shows the Scatter Chart that displays the polls on the referendum 2014 in Scotland. On this Scatter Chart the data are represented as points with two values of variables in the Cartesian coordinates. The points are connected by lines. This diagram can be useful in different opinion polls, referendums, for creating the reports.Scatter Diagram
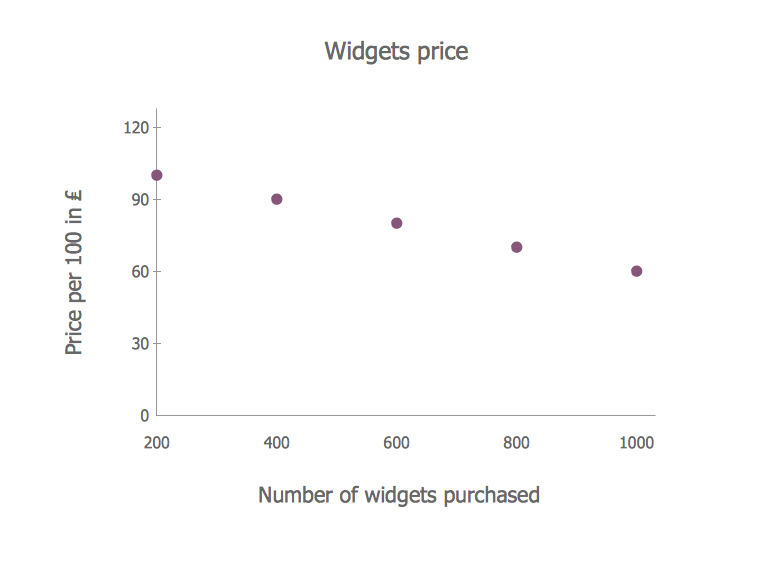
This sample shows the scatter diagram that displays the inverse correlation. The correlation measures the strength of association among two variables. You can see that when the number of widgets increases, the price per 100 widgets decreases.Using the ready-to-use objects from the Line Graphs Solution for ConceptDraw PRO you can create your own professional looking Scatter Charts quick and easy.
Line Graph Charting Software
To design line and scatter charts use ConceptDraw PRO diagramming and vector drawing software extended with Line Graphs solution from Graphs and Charts area of ConceptDraw PRO Solution Park. (Line chart, scatter chart, 2d chart).Blank Scatter Plot
This sample shows the Scatter Plot without missing categories. It’s very important to no miss the data, because this can have the grave negative consequences. The data on the Scatter Chart are represented as points with two values of variables in the Cartesian coordinates. This sample can be used in the engineering, business, statistics, analytics, at the creating the financial and other types of reports.Percentage Pie Chart. Pie Chart Examples
This sample was created in ConceptDraw PRO diagramming and vector drawing software using the Pie Charts Solution from Graphs and Charts area of ConceptDraw Solution Park.This sample shows the Pie Chart of the approximate air composition. You can see the percentage of oxygen, nitrogen and other gases in the air visualized on this Pie Chart.
 PM Docs
This solution extends ConceptDraw MINDMAP software with the ability to organize project and company documentation and structure information that relates to your project.
Business Report Pie. Pie Chart Examples
This sample shows the Business Report Pie Chart. The Pie Chart visualizes the data as the proportional parts of a whole, illustrates the numerical proportion. Pie Charts are very useful in the business, statistics, analytics, mass media.Pie Chart Word Template. Pie Chart Examples
The Pie Chart visualizes the data as the proportional parts of a whole and looks like a disk divided into sectors. The pie chart is type of graph, pie chart looks as circle devided into sectors. Pie Charts are widely used in the business, statistics, analytics, mass media. It’s very effective way of displaying relative sizes of parts, the proportion of the whole thing.
 Artwork
Artwork solution extends ConceptDraw PRO software with illustration samples, templates and libraries of vector clipart of architecture, food, music, funny animals, aquatic fauna and transport.
 Audio, Video, Media
This solution extends ConceptDraw PRO software with samples, templates and library of vector clipart of audio, media, video and photo equipment for drawing the illustrations.
- Line Chart Examples | How to Create a Line Chart | Line Graph ...
- Create Graphs and Charts | Basic Diagramming | Line Graph ...
- Basic Diagramming | Line Graph Charting Software | Create Graphs ...
- Create Graphs and Charts | Basic Diagramming | The Best Drawing ...
- Create Graphs and Charts | Basic Diagramming | Sales Growth. Bar ...
- Sales Growth. Bar Graphs Example | Create Graphs and Charts ...
- Create Graphs and Charts | Cross-Functional Flowcharts | Process ...
- Create Graphs and Charts | Best Vector Drawing Application for Mac ...
- Line Graph Charting Software | Basic Diagramming | How to Create ...
- Create Graphs and Charts | Business diagrams & Org Charts with ...
- Histograms | Bar Graphs | Basic Diagramming |
- How to Create a Column Chart | Bar Chart Software | Column Chart ...
- Cross-Functional Flowcharts | Cross-Functional Flowchart | Create
- Basic Diagramming | Flowchart Example: Flow Chart of Marketing ...
- Applications | Create Graphs and Charts | Good Flow Chart app for ...
- Basic Diagramming | The Best Drawing Program for Mac | Create ...
- Double Bar Graph | Create Graphs and Charts | Design elements ...
- Create Graphs and Charts | Basic Diagramming | Line Graph ...
- Line Graph Charting Software | Create Graphs and Charts | Chart ...
- Create Graphs and Charts | Sales Growth. Bar Graphs Example ...


