Line Chart
"A line chart or line graph is a type of chart which displays information as a series of data points connected by straight line segments. It is a basic type of chart common in many fields. It is similar to a scatter plot except that the measurement points are ordered (typically by their x-axis value) and joined with straight line segments. A line chart is often used to visualize a trend in data over intervals of time – a time series – thus the line is often drawn chronologically."
You want to draw the Line Chart and need the automated tool? Now it is reality with Line Graphs solution from Graphs and Charts area of ConceptDraw Solution Park.
Example 1. Line Chart in ConceptDraw DIAGRAM
How is it easy create the Line Chart of any complexity using the predesigned vector stencils from the Line Graphs libraries of Line Graphs Solution. Simply drag the needed graph from the library and make the needed changes which correspond to your data.

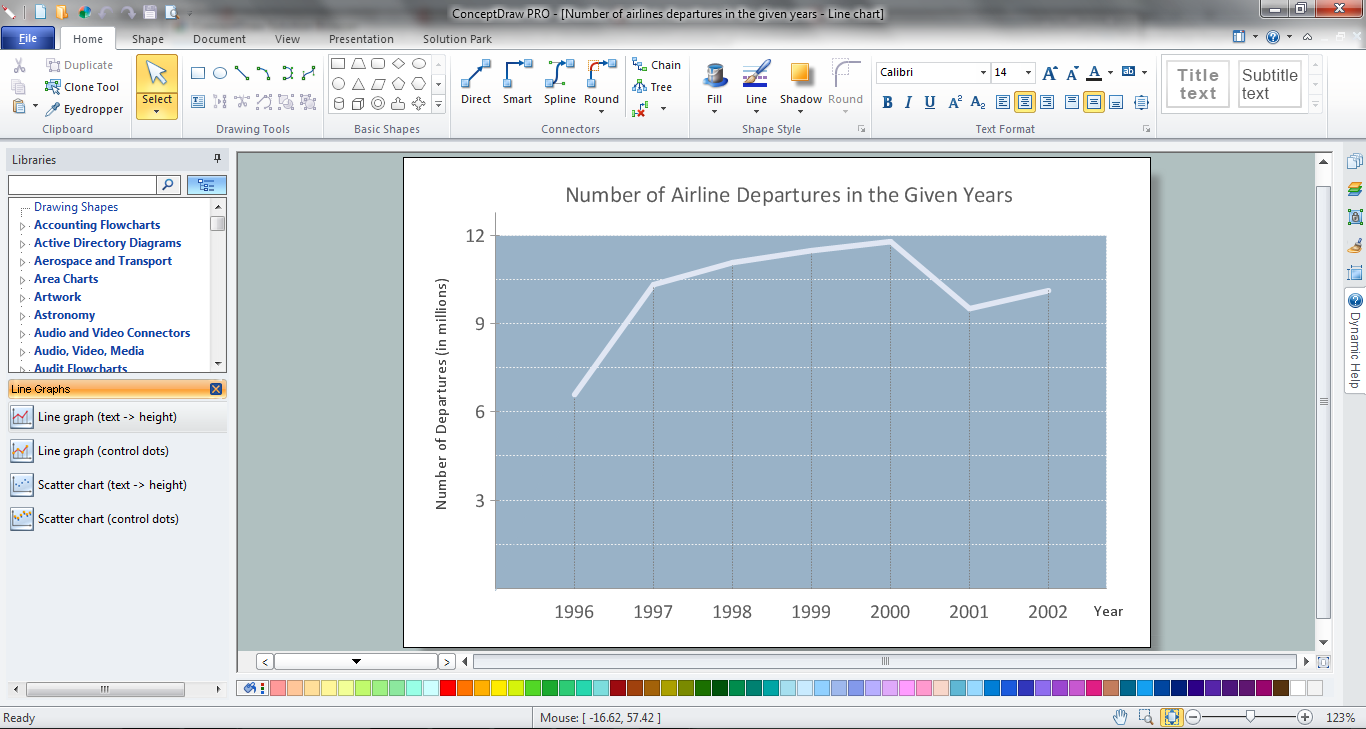
Example 2. Line Chart - Number of airlines departures in the given years
This sample was created in ConceptDraw DIAGRAM using the Line Graphs solution from Graphs and Charts area and shows the line chart of airlines departures in the given 1996-2002 years. An experienced user spent 5 minutes creating this sample.
Use the Line Graphs Solution for ConceptDraw DIAGRAM to create your own professional looking and attractive Line Chart of any complexity quick, easy and effective.
The Line Chart designed with ConceptDraw DIAGRAM is vector graphic documents and is available for reviewing, modifying, converting to a variety of formats (image, HTML, PDF file, MS PowerPoint Presentation, Adobe Flash or MS Visio), printing and send via e-mail in one moment.


