 Pie Charts
Pie Charts are extensively used in statistics and business for explaining data and work results, in mass media for comparison (i.e. to visualize the percentage for the parts of one total), and in many other fields. The Pie Charts solution for ConceptDraw PRO v10 offers powerful drawing tools, varied templates, samples, and a library of vector stencils for simple construction and design of Pie Charts, Donut Chart, and Pie Graph Worksheets.
 Accounting Flowcharts
Accounting Flowcharts solution extends ConceptDraw PRO software with templates, samples and library of vector stencils for drawing the accounting flow charts.
HelpDesk
How to Create Cisco Network Diagrams

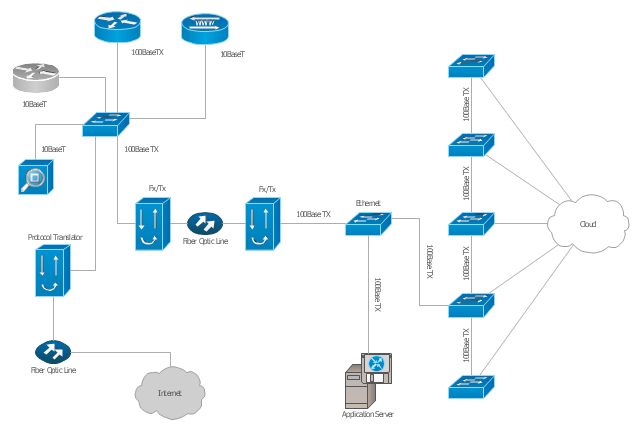
The Cisco Network Diagrams solution uses Cisco network symbols to to visually document the topology and design of Cisco networks.
"A computer network diagram is a schematic depicting the nodes and connections amongst nodes in a computer network or, more generally, any telecommunications network. ...
Depending on whether the diagram is intended for formal or informal use, certain details may be lacking and must be determined from context. ...
At different scales diagrams may represent various levels of network granularity. At the LAN level, individual nodes may represent individual physical devices, such as hubs or file servers, while at the WAN level, individual nodes may represent entire cities. In addition, when the scope of a diagram crosses the common LAN/ MAN/ WAN boundaries, representative hypothetical devices may be depicted instead of showing all actually existing nodes." [Computer network diagram. Wikipedia]
The Cisco computer network diagram example "Network organization chart" was created using the ConceptDraw PRO diagramming and vector drawing software extended with the Cisco Network Diagrams solution from the Computer and Networks area of ConceptDraw Solution Park.
Cisco network diagram
 Telecommunication Network Diagrams
Telecommunication Network Diagrams solution extends ConceptDraw PRO software with samples, templates and libraries of vector stencils for drawing the diagrams of telecommunication networks.
 Cisco Network Diagrams
Cisco Network Diagrams solution extends ConceptDraw PRO software with samples, templates and libraries of vector stencils for drawing the Cisco computer network diagrams.
 Organizational Charts
Organizational Charts solution extends ConceptDraw PRO software with samples, templates and library of vector stencils for drawing the org charts.
 Area Charts
Area Charts are used to display the cumulative totals over time using numbers or percentages; or to show trends over time among related attributes. The Area Chart is effective when comparing two or more quantities. Each series of data is typically represented with a different color, the use of color transparency in an object’s transparency shows overlapped areas and smaller areas hidden behind larger areas.
 ConceptDraw Solution Park
ConceptDraw Solution Park collects graphic extensions, examples and learning materials
 Graphs and Charts Area
Solutions from the Graphs and Charts Area of ConceptDraw Solution Park collect templates, samples and libraries of vector stencils for visualization of numerical data.
 Computer Network Diagrams
Computer Network Diagrams solution extends ConceptDraw PRO software with samples, templates and libraries of vector stencils for drawing the computer network topology diagrams.
 Computer and Networks Area
The solutions from Computer and Networks Area of ConceptDraw Solution Park collect samples, templates and vector stencils libraries for drawing computer and network diagrams, schemes and technical drawings.
 Bar Graphs
The Bar Graphs solution enhances ConceptDraw PRO v10 functionality with templates, numerous professional-looking samples, and a library of vector stencils for drawing different types of Bar Graphs, such as Simple Bar Graph, Double Bar Graph, Divided Bar Graph, Horizontal Bar Graph, Vertical Bar Graph, and Column Bar Chart.
 Audit Flowcharts
Audit flowcharts solution extends ConceptDraw PRO software with templates, samples and library of vector stencils for drawing the audit and fiscal flow charts.
 Flowcharts
The Flowcharts Solution for ConceptDraw PRO v10 is a comprehensive set of examples and samples in several different color themes for professionals that need to graphically represent a process. Solution value is added by basic flow chart template and shapes' library of Flowchart notation. ConceptDraw PRO flow chart creator lets one depict a processes of any complexity and length, as well design of the flowchart either vertically or horizontally.
 Picture Graphs
Typically, a Picture Graph has very broad usage. They many times used successfully in marketing, management, and manufacturing. The Picture Graphs Solution extends the capabilities of ConceptDraw PRO v10 with templates, samples, and a library of professionally developed vector stencils for designing Picture Graphs.
 Line Graphs
How to draw a Line Graph with ease? The Line Graphs solution extends the capabilities of ConceptDraw PRO v10 with professionally designed templates, samples, and a library of vector stencils for drawing perfect Line Graphs.
- Network organization chart | Network Visualization with ...
- Computer Network Architecture | Diagramming software for Amazon ...
- Business Diagram Software | Computer Network Diagrams ...
- Examples of Flowcharts , Org Charts and More | Network Architecture ...
- How to Draw a Computer Network Diagrams | Examples of ...
- Network organization chart | Cisco Network Templates | Network ...
- Accounting Flowcharts | Flowchart Symbols Accounting. Activity ...
- Computer Network Diagrams | Examples of Flowcharts , Org Charts ...
- Accounting Flowcharts | Types of Flowchart - Overview | Flowchart ...
- Office wireless network plan | Computer and Networks | Examples of ...
- How to Draw an Organization Chart | How to Draw a Computer ...
- Network organization chart | Venn Diagram Examples for Problem ...
- Examples of Flowcharts , Org Charts and More | Network Diagram ...
- Computer and Networks | Examples of Flowcharts , Org Charts and ...
- Examples of Flowcharts , Org Charts and More | Network Diagram ...
- Business Diagram Software | Examples of Flowcharts , Org Charts ...
- How to Draw a Computer Network Diagrams
- Network organization chart | Cisco Network Templates | Cisco ...
- Organizational Charts | Management | Network Drawing Software |
- Network Diagram Examples | Network Architecture | Network Layout ...
- ERD | Entity Relationship Diagrams, ERD Software for Mac and Win
- Flowchart | Basic Flowchart Symbols and Meaning
- Flowchart | Flowchart Design - Symbols, Shapes, Stencils and Icons
- Flowchart | Flow Chart Symbols
- Electrical | Electrical Drawing - Wiring and Circuits Schematics
- Flowchart | Common Flowchart Symbols
- Flowchart | Common Flowchart Symbols