Bar Diagrams for Problem Solving. Create space science bar charts with Bar Graphs Solution

Venn Diagram Examples for Problem Solving. Computer Science. Chomsky Hierarchy

Pie Chart Software

 Pie Charts
Pie Charts are extensively used in statistics and business for explaining data and work results, in mass media for comparison (i.e. to visualize the percentage for the parts of one total), and in many other fields. The Pie Charts solution for ConceptDraw DIAGRAM offers powerful drawing tools, varied templates, samples, and a library of vector stencils for simple construction and design of Pie Charts, Donut Chart, and Pie Graph Worksheets.
Venn Diagram Examples for Problem Solving

 Bar Graphs
The Bar Graphs solution enhances ConceptDraw DIAGRAM functionality with templates, numerous professional-looking samples, and a library of vector stencils for drawing different types of Bar Graphs, such as Simple Bar Graph, Double Bar Graph, Divided Bar Graph, Horizontal Bar Graph, Vertical Bar Graph, and Column Bar Chart.
ConceptDraw DIAGRAM Compatibility with MS Visio

 Telecommunication Network Diagrams
Telecommunication Network Diagrams solution extends ConceptDraw DIAGRAM software with samples, templates, and great collection of vector stencils to help the specialists in a field of networks and telecommunications, as well as other users to create Computer systems networking and Telecommunication network diagrams for various fields, to organize the work of call centers, to design the GPRS networks and GPS navigational systems, mobile, satellite and hybrid communication networks, to construct the mobile TV networks and wireless broadband networks.
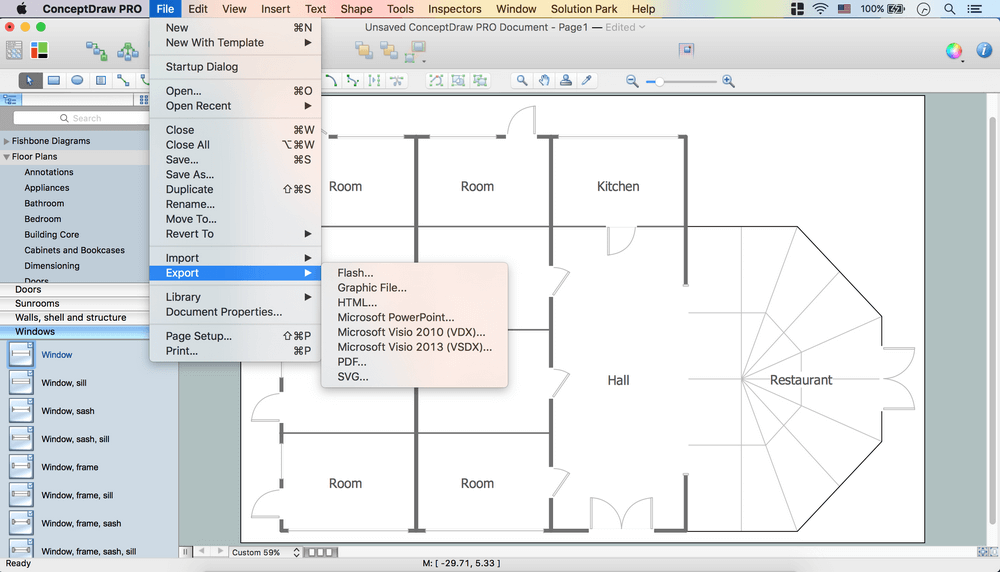
Create Floor Plans Easily with ConceptDraw DIAGRAM

 Office Layout Plans
Office layouts and office plans are a special category of building plans and are often an obligatory requirement for precise and correct construction, design and exploitation office premises and business buildings. Designers and architects strive to make office plans and office floor plans simple and accurate, but at the same time unique, elegant, creative, and even extraordinary to easily increase the effectiveness of the work while attracting a large number of clients.
 Astronomy
Astronomy solution extends ConceptDraw DIAGRAM software with illustration and sketching software with templates, samples and libraries of a variety of astronomy symbols, including constellations, galaxies, stars, and planet vector shapes; a whole host of cele
 Aerospace and Transport
This solution extends ConceptDraw DIAGRAM software with templates, samples and library of vector clipart for drawing the Aerospace and Transport Illustrations. It contains clipart of aerospace objects and transportation vehicles, office buildings and anci
 Event-driven Process Chain Diagrams
Event-Driven Process Chain Diagrams solution extends ConceptDraw DIAGRAM functionality with event driven process chain templates, samples of EPC engineering and modeling the business processes, and a vector shape library for drawing the EPC diagrams and EPC flowcharts of any complexity. It is one of EPC IT solutions that assist the marketing experts, business specialists, engineers, educators and researchers in resources planning and improving the business processes using the EPC flowchart or EPC diagram. Use the EPC solutions tools to construct the chain of events and functions, to illustrate the structure of a business process control flow, to describe people and tasks for execution the business processes, to identify the inefficient businesses processes and measures required to make them efficient.
- Bar Diagrams for Problem Solving. Create space science bar charts ...
- Scientific Symbols Chart | Bar Diagrams for Problem Solving. Create ...
- Bar Diagrams for Problem Solving. Create space science bar charts ...
- Chemistry | Bar Diagrams for Problem Solving. Create space ...
- Bar Graphs | Bar Diagrams for Problem Solving. Create space ...
- Chemistry Drawings | Bar Diagrams for Problem Solving. Create ...
- | Bar Diagrams for Problem Solving. Create space science bar ...
- Divided Bar Diagrams | Bar Diagrams for Problem Solving. Create ...
- Diagram Of A Bar Graph
- Bar Chart Or Bar Graph For Problem Solving
- Venn Diagram Examples for Problem Solving. Computer Science ...
- Bar Chart Template for Word | Bar Diagrams for Problem Solving ...
- Samples Of Charts About Science
- Scientific Method Flow Chart
- Bar Diagrams for Problem Solving. Create economics and financial ...
- Science Diagrams Chemistry
- How to Draw the Different Types of Pie Charts | Bar Diagrams for ...
- Materials Order Bar Chart Sample
- Problems Of Bar Chart
- Process Flowchart | Organizational Structure | How to Draw an ...