"Citric acid cycle (tricarboxylic acid cycle, TCA cycle, Krebs cycle) is a series of chemical reactions used by all aerobic organisms to generate energy through the oxidation of acetate derived from carbohydrates, fats and proteins into carbon dioxide and chemical energy in the form of adenosine triphosphate (ATP)." [Citric acid cycle. Wikipedia]
This biochemical diagram example shows metabolic pathways map of citric acid cycle reactions.
This sample was redesigned from the Wikimedia Commons file: TCA cycle.svg. [commons.wikimedia.org/ wiki/ File:TCA_ cycle.svg]
This image is licensed under the Creative Commons Attribution 3.0 Unported license. [creativecommons.org/ licenses/ by/ 3.0/ deed.en]
The metabolic pathway map example "Citric acid cycle (TCA cycle)" was created using the ConceptDraw PRO diagramming and vector drawing software extended with the Biology solution from the Science and Education area of ConceptDraw Solution Park.
Tricarboxylic acid cycle
.png--diagram-flowchart-example.png)
The vector stencils library "Citric acid cycle (TCA cycle)" contains 26 symbols of metabolites for drawing metabolic pathway maps and biochemical shematic diagrams of the citric acid cycle (TCA cycle, tricarboxylic acid cycle, Krebs cycle) and diagrams of metabolism processes.
"The citric acid cycle - also known as the tricarboxylic acid cycle (TCA cycle), or the Krebs cycle, - is a series of chemical reactions used by all aerobic organisms to generate energy through the oxidation of acetate derived from carbohydrates, fats and proteins into carbon dioxide and chemical energy in the form of adenosine triphosphate (ATP). In addition, the cycle provides precursors of certain amino acids as well as the reducing agent NADH that is used in numerous other biochemical reactions. Its central importance to many biochemical pathways suggests that it was one of the earliest established components of cellular metabolism and may have originated abiogenically.
The name of this metabolic pathway is derived from citric acid (a type of tricarboxylic acid) that is consumed and then regenerated by this sequence of reactions to complete the cycle. In addition, the cycle consumes acetate (in the form of acetyl-CoA) and water, reduces NAD+ to NADH, and produces carbon dioxide as a waste byproduct. The NADH generated by the TCA cycle is fed into the oxidative phosphorylation (electron transport) pathway. The net result of these two closely linked pathways is the oxidation of nutrients to produce usable chemical energy in the form of ATP." [Citric acid cycle. Wikipedia]
The shapes example "Design elements - TCA cycle" is included in the Biology solution from the Science and Education area of ConceptDraw Solution Park.
Tricarboxylic acid cycle (Krebs cycle) symbols
-symbols--design-elements---tca-cycle.png--diagram-flowchart-example.png)
Biology Symbols

Biology solution provides 3 libraries with large quantity of vector biology symbols: Biochemistry of Metabolism Library, Carbohydrate Metabolism Library, Citric Acid Cycle (TCA Cycle) Library.
Biology Illustration

 Biology
Being involved in the study of biology, the ConceptDraw DIAGRAM diagramming and drawing software can be used and so Biology solution as its extension. The last-mentioned tool provides all the ConceptDraw DIAGRAM users with the pre-made biology-related samples and templates as well as the stencil libraries that contain many of the biological vector symbols. In order to create educational and scientific designs in the field of biology and to visually explain some complex knowledge within such sub-disciplines of biology as biochemistry, microbiology, molecular and cell biology, genomics and proteomics, biotechnology and genetics, the Biology solution may be used by any ConceptDraw DIAGRAM user.
How To Print Audio & Video Connectors Schema in a Large Format

Flowchart Maker

Drawing a Nature Scene

Healthy Diet Plan

UML State Machine Diagram.Design Elements

Restaurant Floor Plans Software

Electrical Symbols — Thermo

Process Flowchart


Venn Diagram Examples for Problem SolvingComputer Science. Chomsky Hierarchy

The vector stencils library " Biochemistry of metabolism" contains 46 metabolite symbols for drawing metabolic pathways maps, biochemical diagrams and metabolism process flow charts using the ConceptDraw PRO diagramming and vector drawing software.
"Metabolites are the intermediates and products of metabolism. The term metabolite is usually restricted to small molecules. Metabolites have various functions, including fuel, structure, signaling, stimulatory and inhibitory effects on enzymes, catalytic activity of their own (usually as a cofactor to an enzyme), defense, and interactions with other organisms (e.g. pigments, odorants, and pheromones). A primary metabolite is directly involved in normal "growth", development, and reproduction. Alcohol is an example of a primary metabolite produced in large-scale by industrial microbiology. A secondary metabolite is not directly involved in those processes, but usually has an important ecological function. Examples include antibiotics and pigments such as resins and terpenes etc. ...
The metabolome forms a large network of metabolic reactions, where outputs from one enzymatic chemical reaction are inputs to other chemical reactions." [Metabolite. Wikipedia]
The shapes example "Design elements - Biochemistry of metabolism" is included in the Biology solution from the Science and Education area of ConceptDraw Solution Park.
Metabolic pathway symbols
"Carbohydrate catabolism is the breakdown of carbohydrates into smaller units. Carbohydrates literally undergo combustion to retrieve the large amounts of energy in their bonds. Energy is secured by mitochondria in the form of ATP.
There are several different types of carbohydrates: polysaccharides (e.g., starch, amylopectin, glycogen, cellulose), monosaccharides (e.g., glucose, galactose, fructose, ribose) and the disaccharides (e.g., maltose, lactose).
Glucose reacts with oxygen in the following redox reaction, C6H12O6 + 6O2 → 6CO2 + 6H2O, the carbon dioxide and water is a waste product and the chemical reaction is exothermic.
The breakdown of glucose into energy in the form of molecules of ATP is therefore one of the most important biochemical pathways found in living organisms." [Carbohydrate catabolism. Wikipedia]
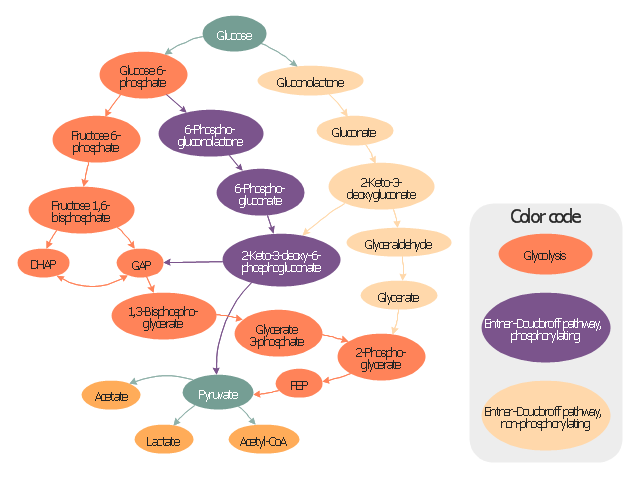
This glucose catabolism pathways map shows glycolysis by orange color, Entner-Doudoroff phosphorylating pathway by green color, Entner-Doudoroff non-phosphorylating pathway by Yellow color.
This methabolic pathway map was redesigned from Wikimedia file: Glucose catabolism pathways.svg. [commons.wikimedia.org/ wiki/ File:Glucose_ catabolism_ pathways.svg]
The biochemical diagram example "Glucose catabolism pathways map" was created using the ConceptDraw PRO diagramming and vector drawing software extended with the Biology solution from the Science and Education area of ConceptDraw Solution Park.
There are several different types of carbohydrates: polysaccharides (e.g., starch, amylopectin, glycogen, cellulose), monosaccharides (e.g., glucose, galactose, fructose, ribose) and the disaccharides (e.g., maltose, lactose).
Glucose reacts with oxygen in the following redox reaction, C6H12O6 + 6O2 → 6CO2 + 6H2O, the carbon dioxide and water is a waste product and the chemical reaction is exothermic.
The breakdown of glucose into energy in the form of molecules of ATP is therefore one of the most important biochemical pathways found in living organisms." [Carbohydrate catabolism. Wikipedia]
This glucose catabolism pathways map shows glycolysis by orange color, Entner-Doudoroff phosphorylating pathway by green color, Entner-Doudoroff non-phosphorylating pathway by Yellow color.
This methabolic pathway map was redesigned from Wikimedia file: Glucose catabolism pathways.svg. [commons.wikimedia.org/ wiki/ File:Glucose_ catabolism_ pathways.svg]
The biochemical diagram example "Glucose catabolism pathways map" was created using the ConceptDraw PRO diagramming and vector drawing software extended with the Biology solution from the Science and Education area of ConceptDraw Solution Park.
Catabolic pathway map
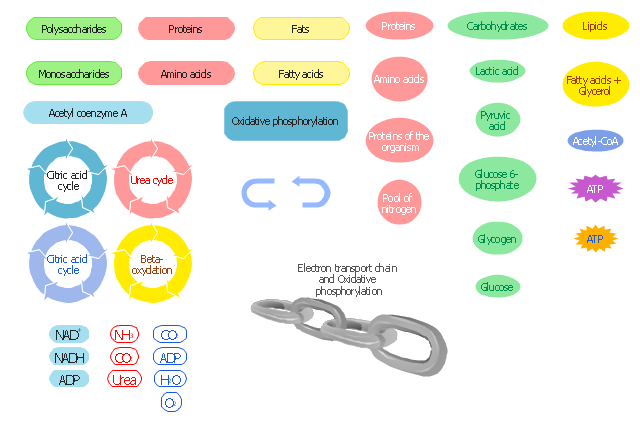
"Metabolism is refer to all chemical reactions that occur in living organisms, including digestion and the transport of substances into and between different cells. Metabolism is usually divided into catabolism, that breaks down organic matter and harvests energy by way of cellular respiration, and anabolism that uses energy to construct components of cells such as proteins and nucleic acids.
The chemical reactions of metabolism are organized into metabolic pathways, in which one chemical is transformed through a series of steps into another chemical, by a sequence of enzymes." [Metabolism. Wikipedia]
The biochemical pathway map example "Key metabolic processes" was created using the ConceptDraw PRO diagramming and vector drawing software extended with the Biology solution from the Science and Education area of ConceptDraw Solution Park.
Metabolic pathway map
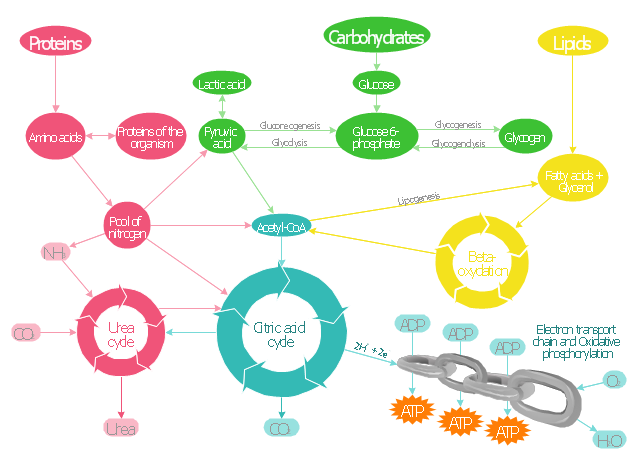
"In biochemistry, metabolic pathways are series of chemical reactions occurring within a cell. In each pathway, a principal chemical is modified by a series of chemical reactions. Enzymes catalyze these reactions, and often require dietary minerals, vitamins, and other cofactors in order to function properly. Because of the many chemicals (a.k.a. "metabolites") that may be involved, metabolic pathways can be quite elaborate. In addition, numerous distinct pathways co-exist within a cell. This collection of pathways is called the metabolic network. Pathways are important to the maintenance of homeostasis within an organism. Catabolic (break-down) and Anabolic (synthesis) pathways often work interdependently to create new biomolecules as the final end-products." [Metabolic pathway. Wikipedia]
The biochemical diagram example "Metabolic pathway map" was created using the ConceptDraw PRO diagramming and vector drawing software extended with the Biology solution from the Science and Education area of ConceptDraw Solution Park.
The biochemical diagram example "Metabolic pathway map" was created using the ConceptDraw PRO diagramming and vector drawing software extended with the Biology solution from the Science and Education area of ConceptDraw Solution Park.
Catabolic pathways

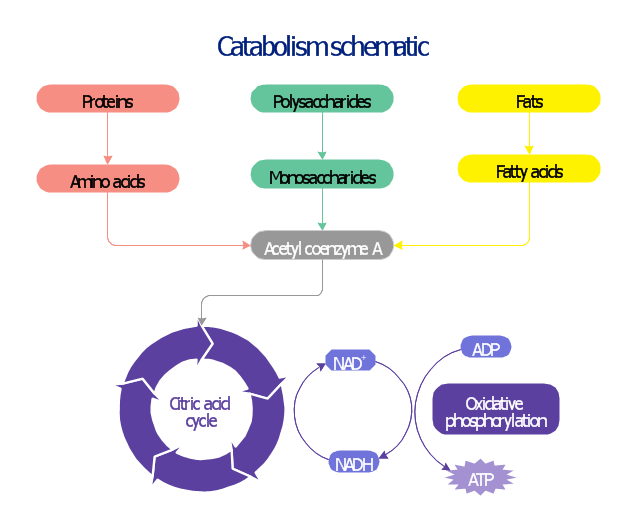
This biochemical chart display how proteins, polysaccharides and fats from food are digested into gastrointestinal tract into aminoacids, monosaccharides and fatty acids, and then broken down and oxidized to carbon dioxide and water in cellular processes of energy generation.
This metabolic pathway map was redesigned from Wikipedia file: Catabolism schematic.svg. [en.wikipedia.org/ wiki/ File:Catabolism_ schematic.svg]
The biochemical diagram example "Catabolism schematic" was created using the ConceptDraw PRO diagramming and vector drawing software extended with the Biology solution from the Science and Education area of ConceptDraw Solution Park.
Catabolic pathway map
Biology Drawing

- Basic Diagramming Flowchart Software | Citric Acid Flow Chat
- Biology | Schematic Representation Citric Acid Cycle
- Biology Symbols | Biology | Biology Illustration | Citric Acid Cycle ...
- Sales Process | Design elements - TCA cycle | Chemistry Drawing ...
- Sales Process | Biology Illustration | Flowchart Of Tca Cycle
- Diagrmatic Representation Of Citric Acid Cycle
- Sales Process | Business Diagram Software - TCA cycle
- Drawing a Nature Scene | Nature | Citric acid cycle ( TCA cycle ...
- Basic Diagramming Flowchart Software | Sales Process - TCA cycle