HelpDesk
How to Draw Geometric Shapes

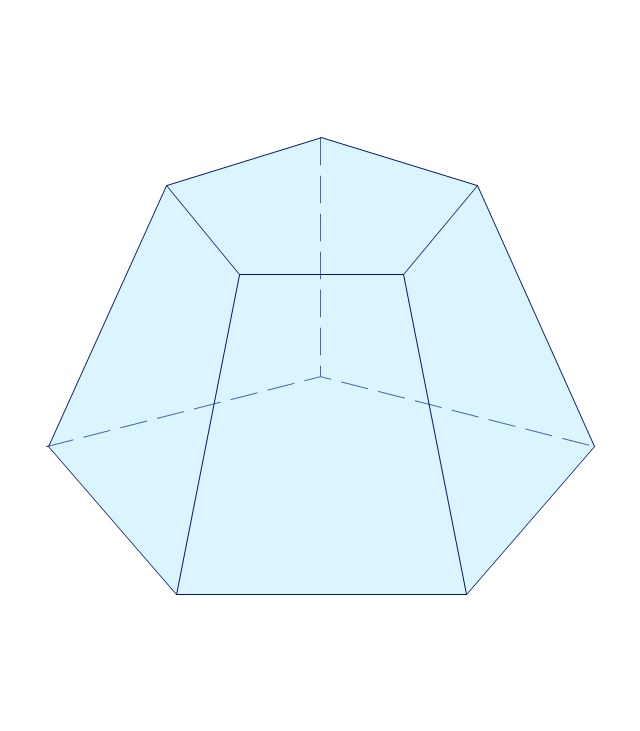
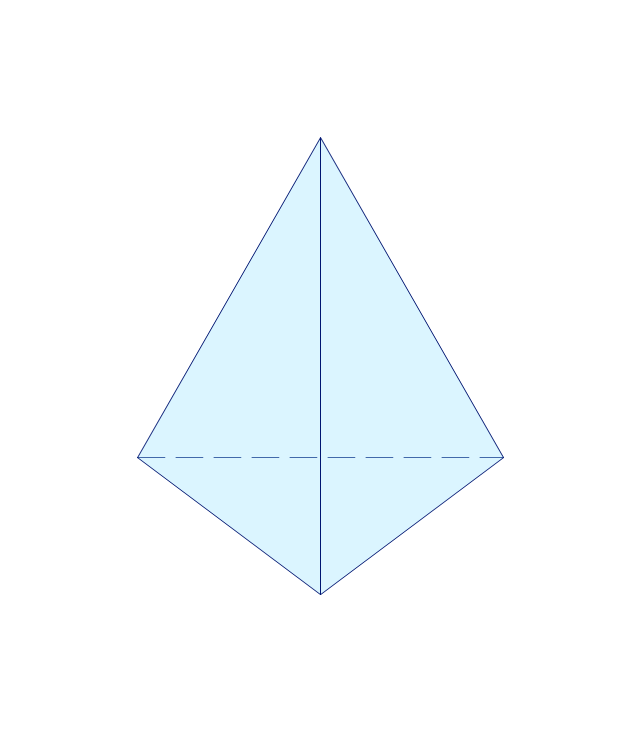
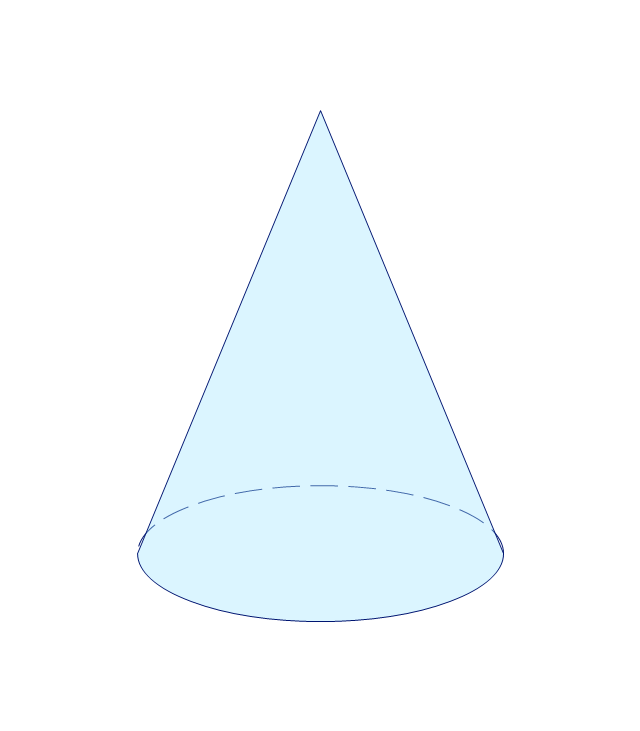
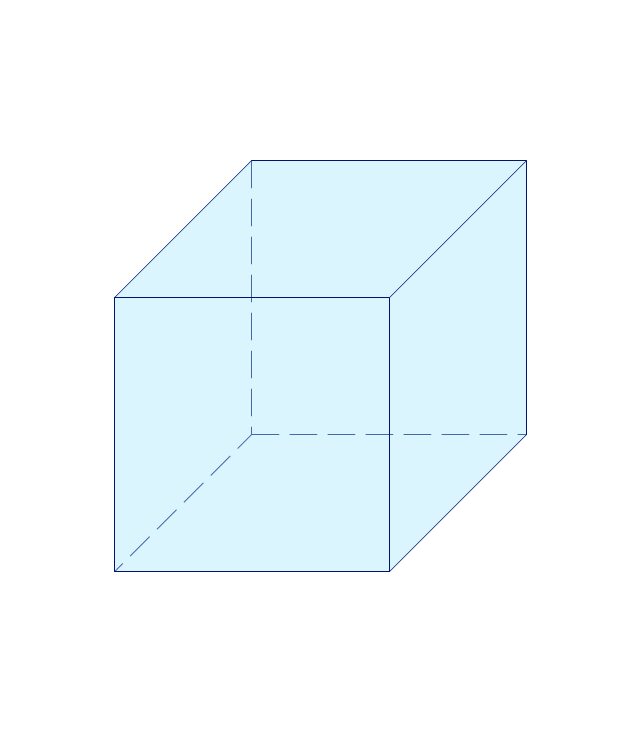
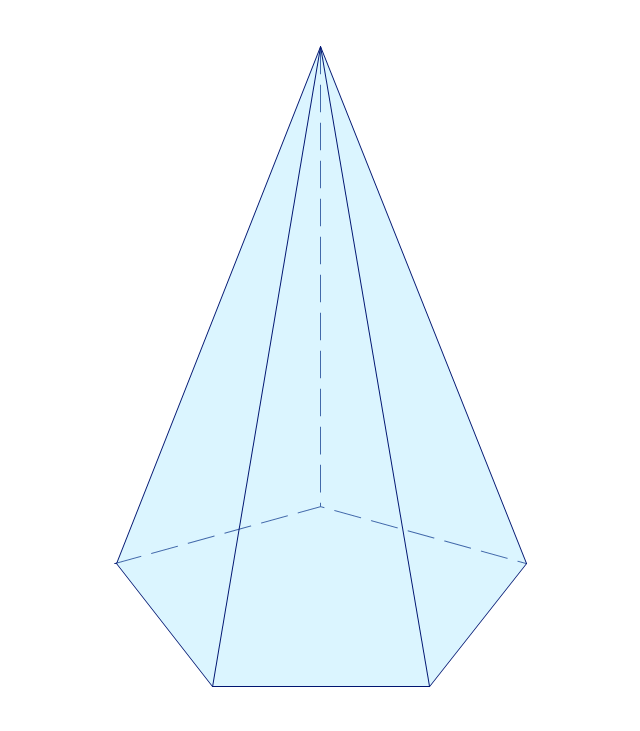
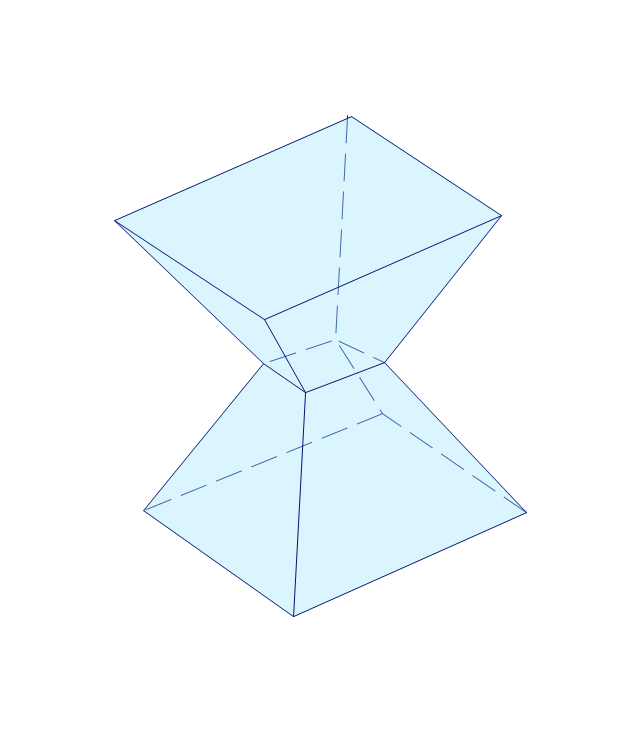
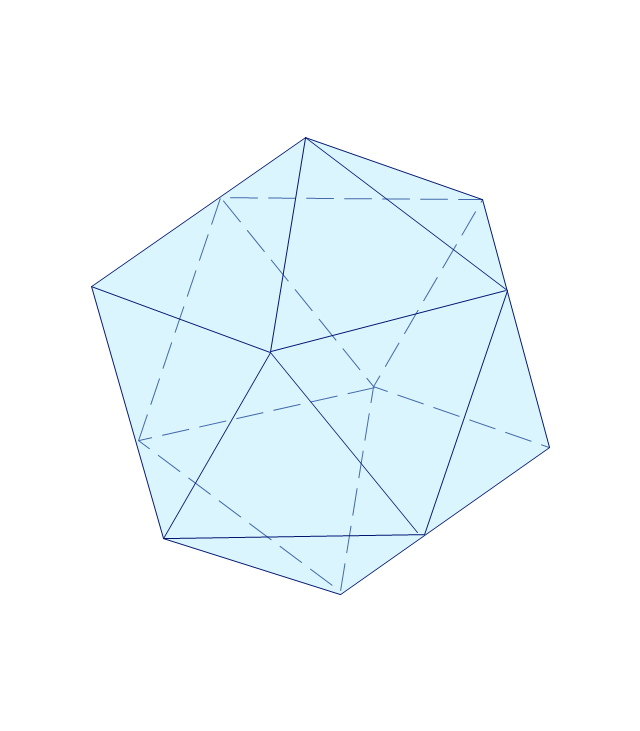
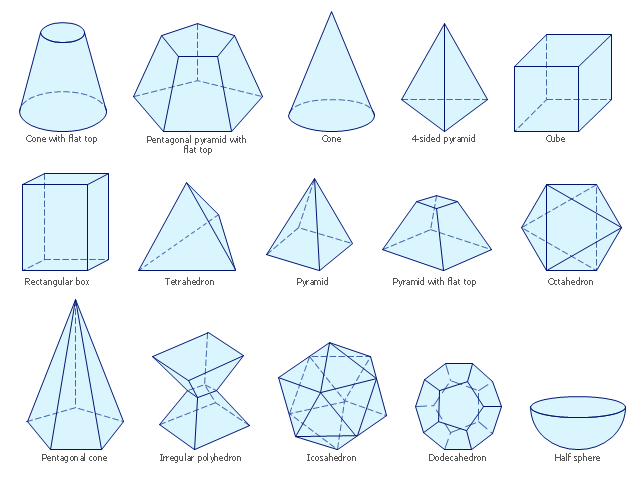
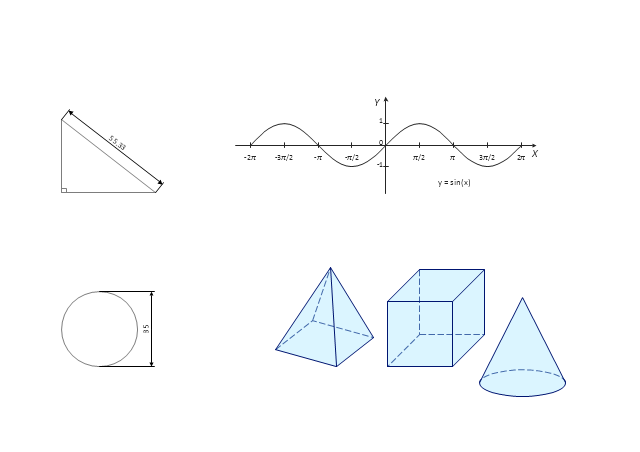
The vector stencils library "Solid geometry" contains 15 shapes of solid geometric figures.
Use these shapes to draw your geometrical diagrams and illustrations in the ConceptDraw PRO diagramming and vector drawing software extended with the Mathematics solution from the Science and Education area of ConceptDraw Solution Park.
Use these shapes to draw your geometrical diagrams and illustrations in the ConceptDraw PRO diagramming and vector drawing software extended with the Mathematics solution from the Science and Education area of ConceptDraw Solution Park.
Conical frustum

Pentagonal frustum
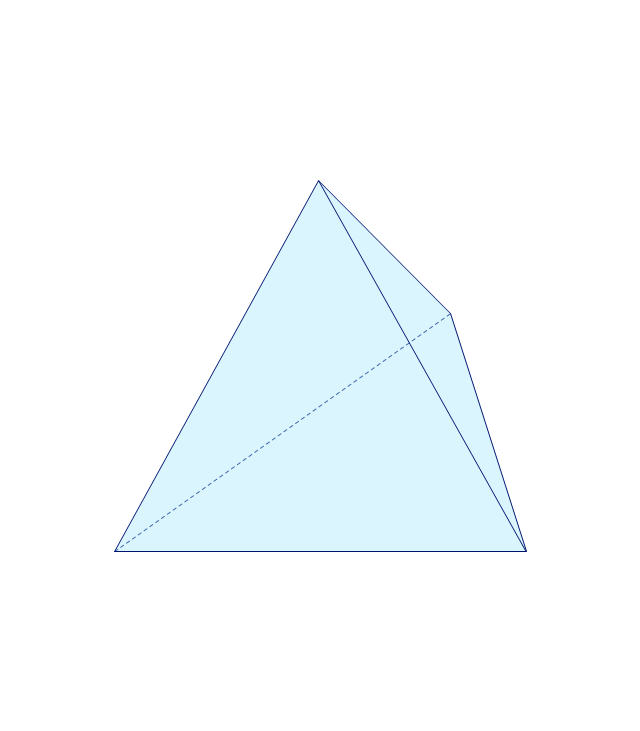
Tetrahedron
Cone
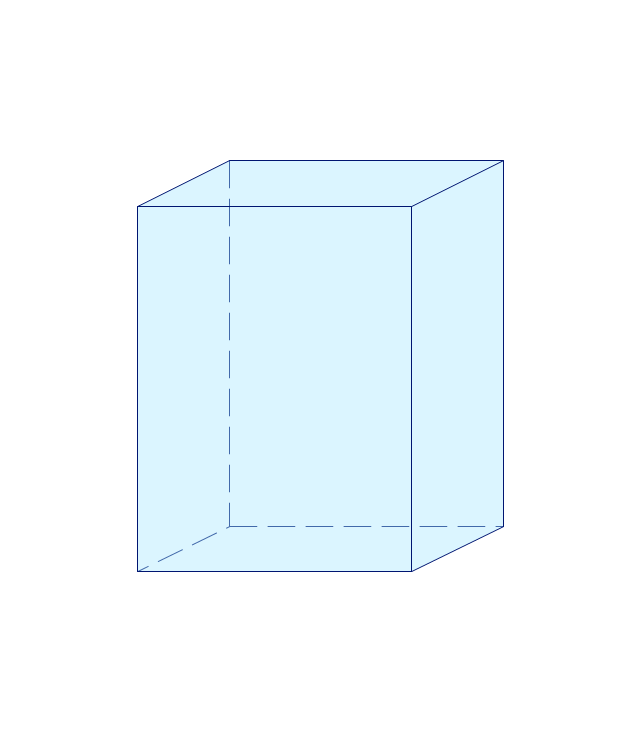
Cube
Rectangular cuboid
Regular tetrahedron
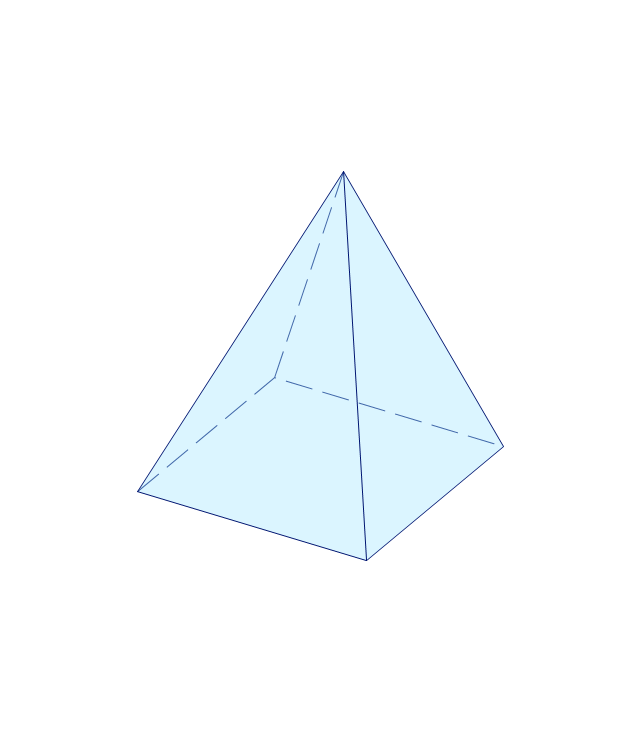
Square pyramid
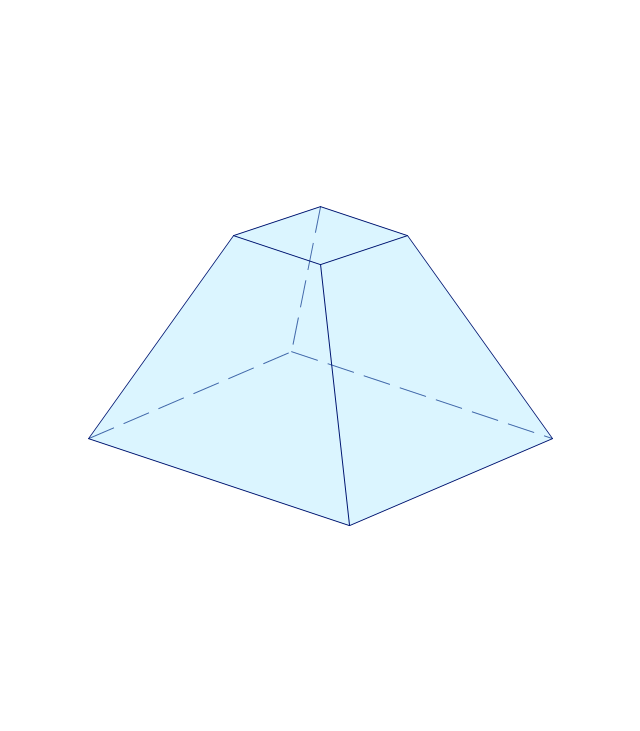
Square frustum
Octahedron
Pentagonal pyramid
Irregular polyhedron
Icosahedron
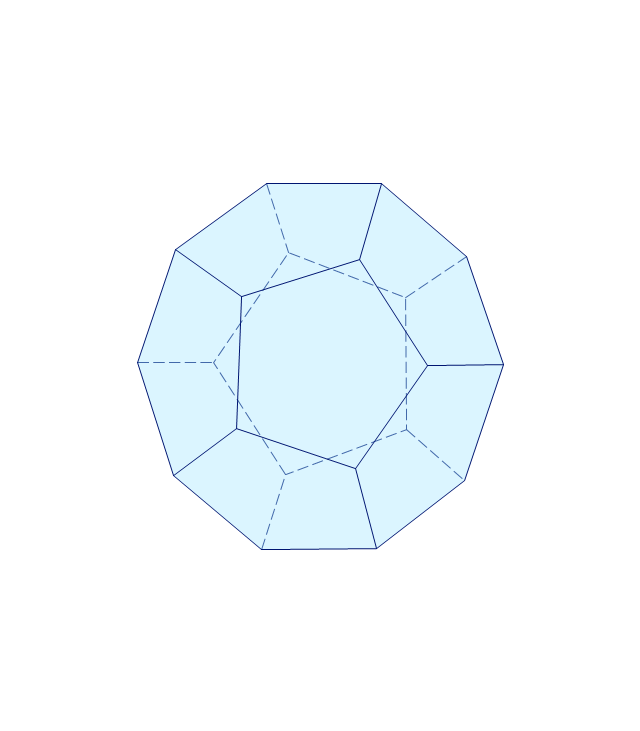
Dodecahedron
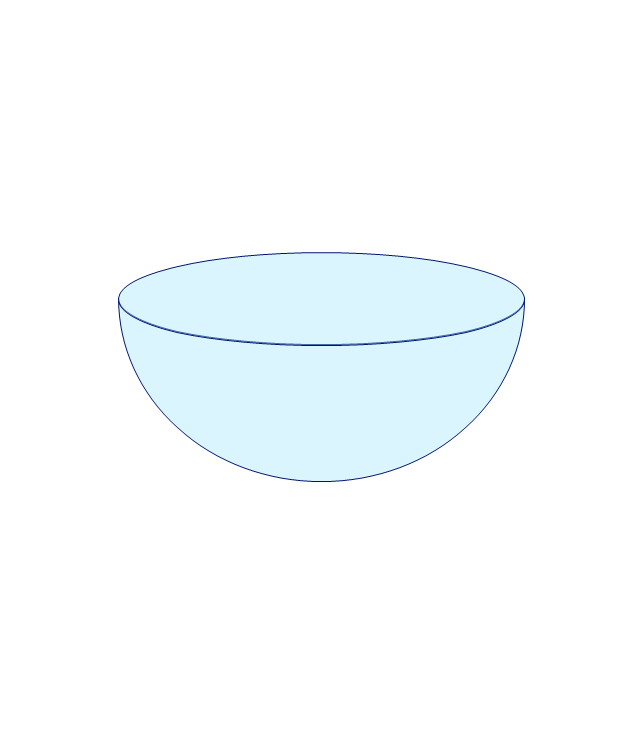
Hemisphere
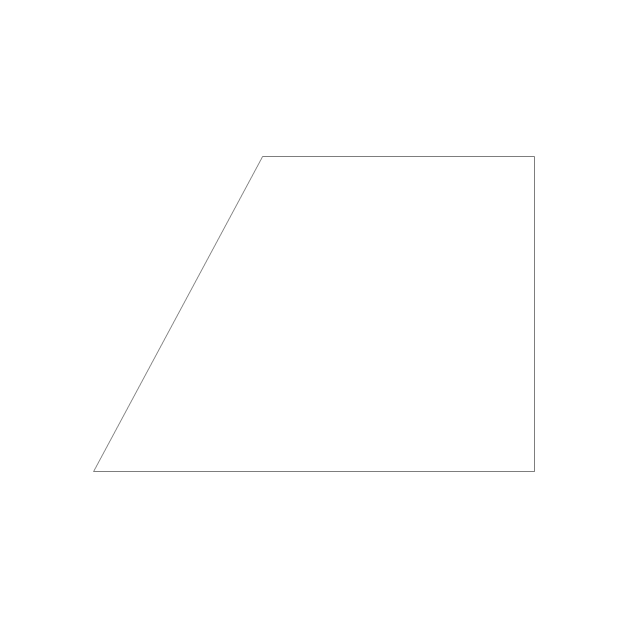
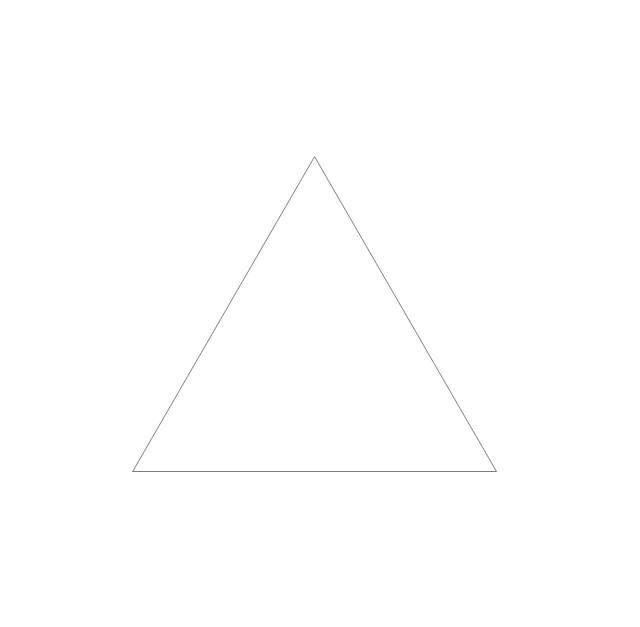
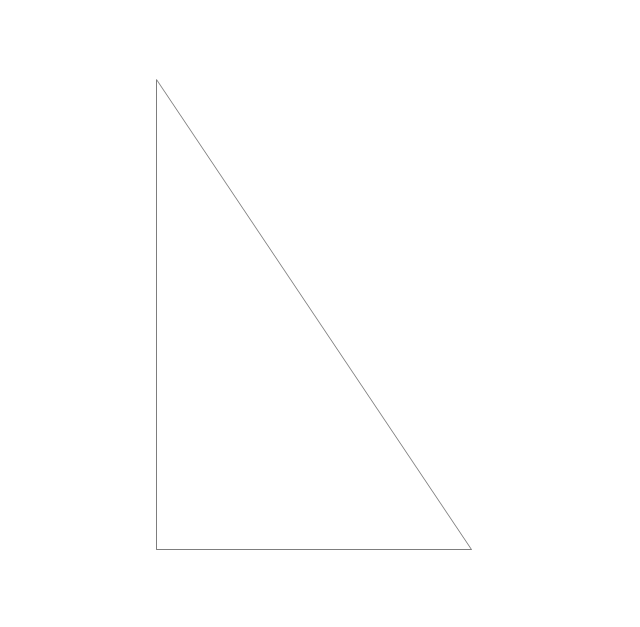
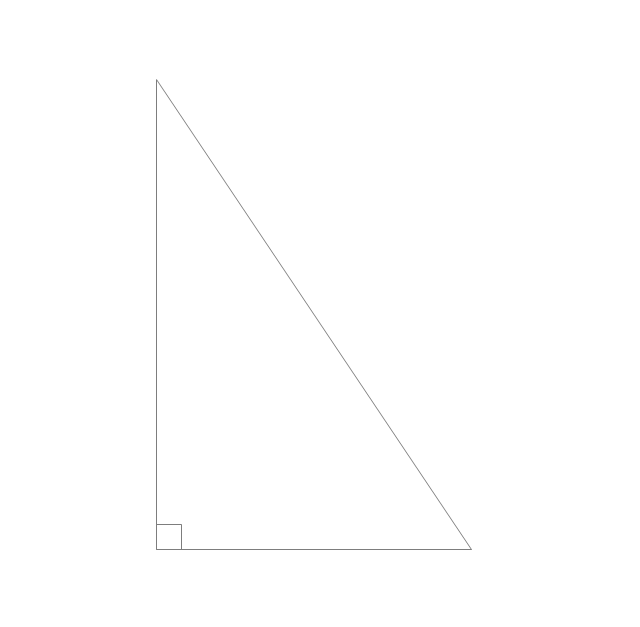
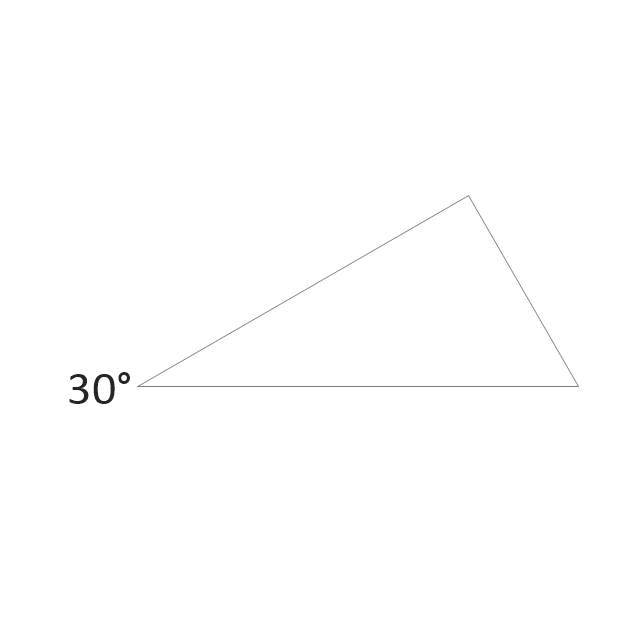
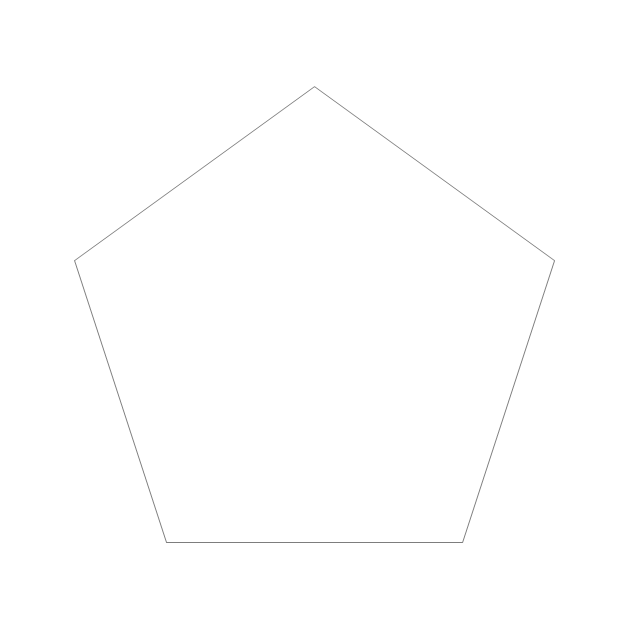
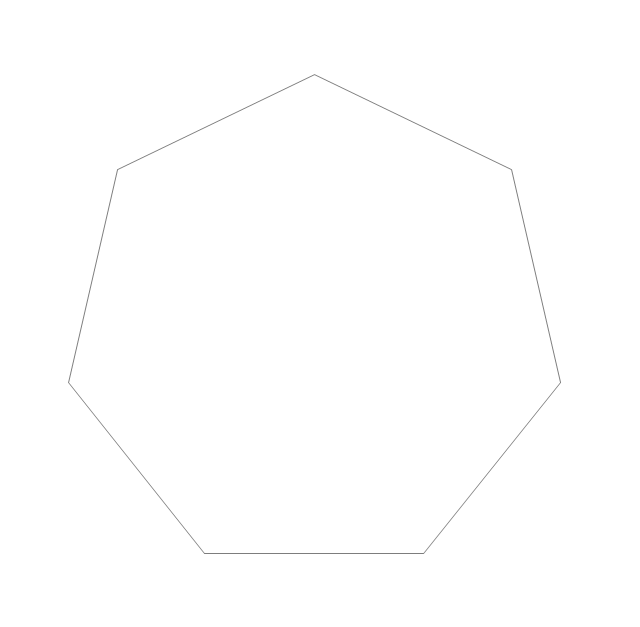
The vector stencils library "Plane geometry" contains 27 plane geometric figures.
Use these shapes to draw your geometrical diagrams and illustrations in the ConceptDraw PRO diagramming and vector drawing software extended with the Mathematics solution from the Science and Education area of ConceptDraw Solution Park.
Use these shapes to draw your geometrical diagrams and illustrations in the ConceptDraw PRO diagramming and vector drawing software extended with the Mathematics solution from the Science and Education area of ConceptDraw Solution Park.
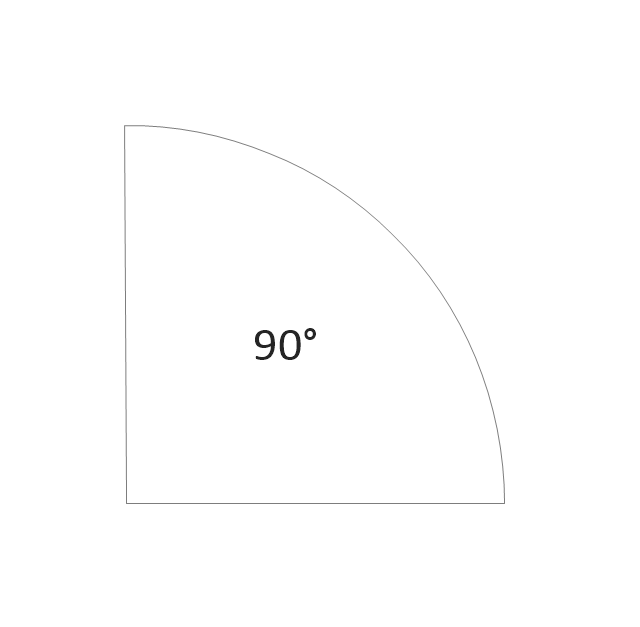
Circular sector
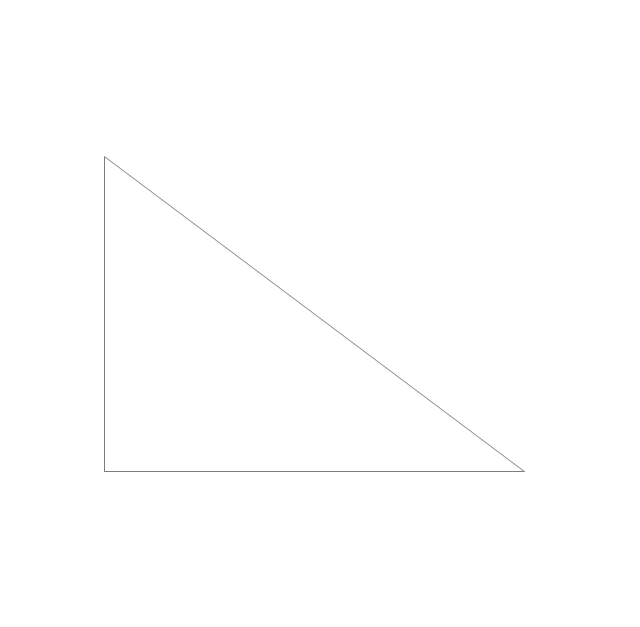
Right triangle
Rectangle

Square
Pentagon
Isosceles trapezium
Parallelogram
Trapezium
Three-pointed star

Four-pointed star

Five-pointed star

Six-pointed star

Seven-pointed star

Eight-pointed star

Triangle
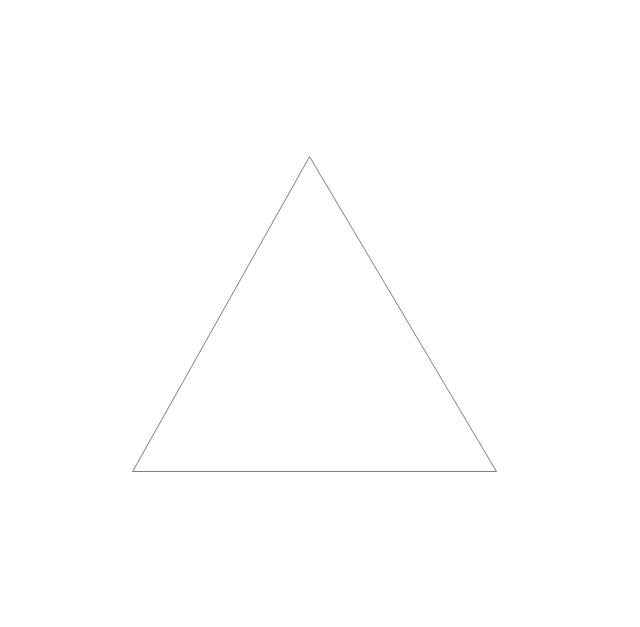
Equilateral triangle
Right triangle 2
Right triangle, angle box
Right triangle 3
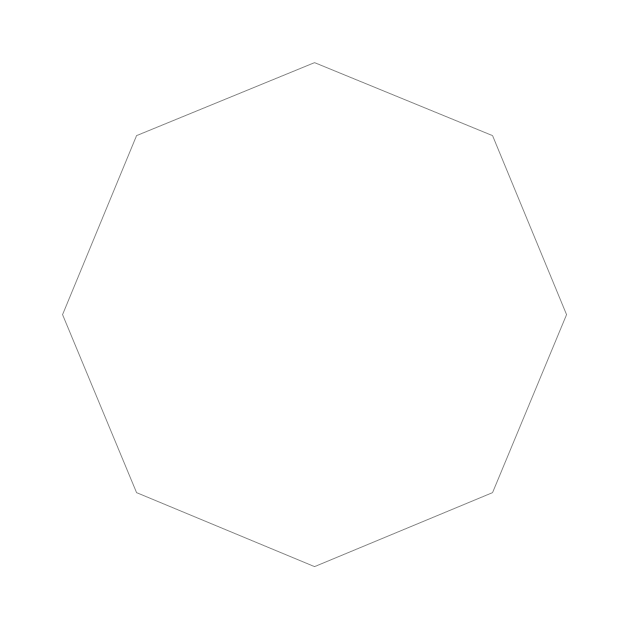
Hexagon

Regular hexagon

Regular pentagon
Regular heptagon
Regular octagon
Rhombus

Circle

Ellipse

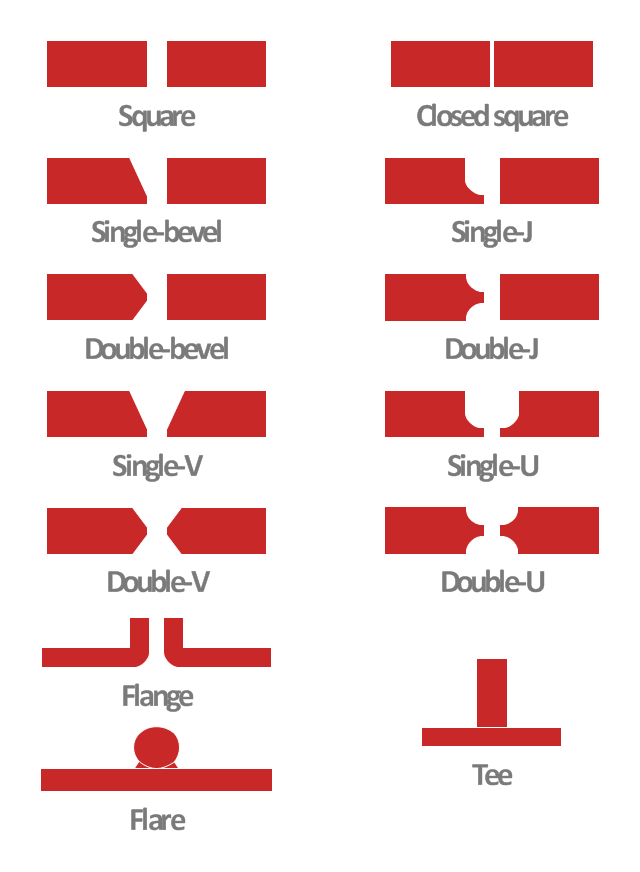
This engineering drawing shows different types of geometry of butt welds.
"Welds can be geometrically prepared in many different ways. The five basic types of weld joints are the butt joint, lap joint, corner joint, edge joint, and T-joint (a variant of this last is the cruciform joint). Other variations exist as well - for example, double-V preparation joints are characterized by the two pieces of material each tapering to a single center point at one-half their height. Single-U and double-U preparation joints are also fairly common - instead of having straight edges like the single-V and double-V preparation joints, they are curved, forming the shape of a U. Lap joints are also commonly more than two pieces thick - depending on the process used and the thickness of the material, many pieces can be welded together in a lap joint geometry." [Welding. Wikipedia]
This engineering drawing example was redesigned using the ConceptDraw PRO diagramming and vector drawing software from the Wikimedia Commons file: Butt Weld Geometry.GIF.
[commons.wikimedia.org/ wiki/ File:Butt_ Weld_ Geometry.GIF]
The engineering drawing example "Butt weld geometry" is included in the Mechanical Engineering solution from the Engineering area of ConceptDraw Solution Park.
Welding joint diagram
Scientific Symbols Chart

Mathematics Solution from the Science and Education area of ConceptDraw Solution Park includes a few shape libraries of plane, solid geometric figures, trigonometrical functions and greek letters to help you create different professional looking mathematic illustrations for science and education.
Mathematics Symbols

 Mathematics
Mathematics is simply essential in many fields, such as natural science, medicine, finance, the social sciences, and engineering. Mathematicians often face the need for creating the mathematical drawings in order to explain different theories and equations. In order to make such illustrations, the ConceptDraw DIAGRAM diagramming and drawing software may be used. The Mathematics solution can be used while working in the ConceptDraw DIAGRAM application using its pre-made samples, templates, and vector shape libraries of both solid and plane geometric figures, trigonometrical functions and mathematical symbols. It may help many mathematicians to create numeral mathematical diagrams, mathematic illustrations and tape diagrams for either scientific or educational, or both purposes.
 Object-Role Modeling (ORM) Diagrams
Object-role Modeling (ORM) Diagram solution with powerful vector diagramming and data modeling tools, large quantity of specially developed samples and examples, and rich variety of vector objects corresponding to common ORM notation, ideally suits for developing the comprehensive, clear and visual Object-role Modeling (ORM) diagrams and schematics, understandable for all interested people from the different fields and business directions, for designing the ORM models, and demonstrating advantages from the use of ORM and its notation. It is intended for software developers and computer engineers, specialists in a field of Object-oriented programming (OOP), database architects, web-application constructors and developers, etc.
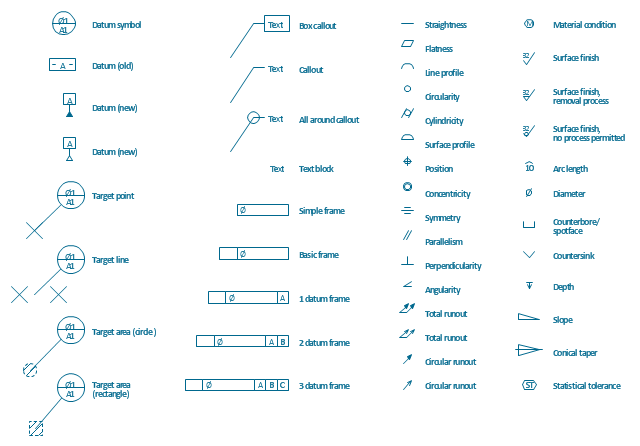
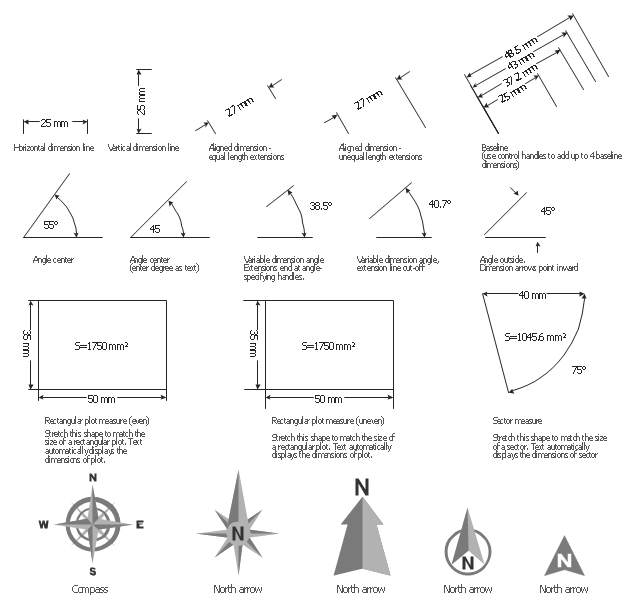
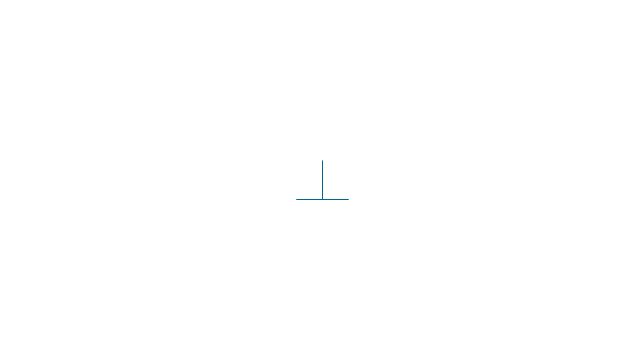
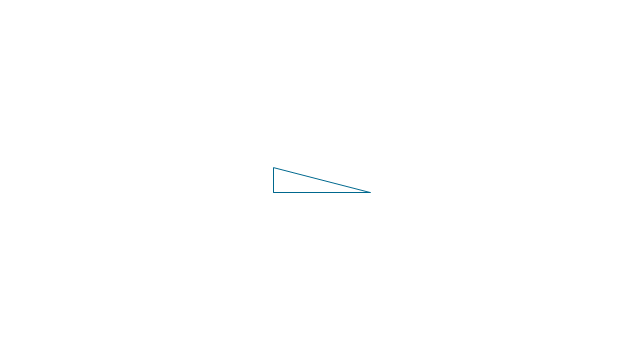
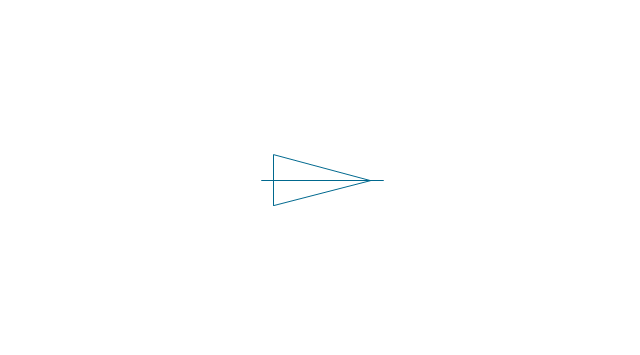
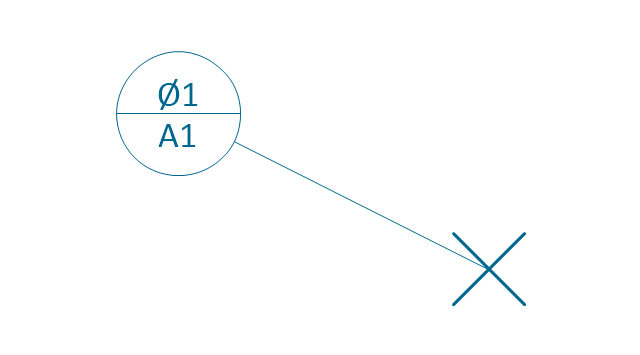
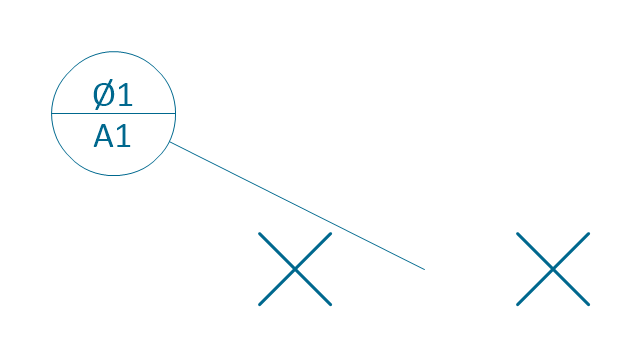
The vector stencils library "Dimensioning and tolerancing" contains 45 symbols of geometric dimensions and mechanical tolerances, geometric symbols, callouts, and text boxes and inserts.
Use these geometric dimensioning and tolerancing (GD&T) shapes to create annotated mechanical drawings.
"Geometric dimensioning and tolerancing (GD&T) is a system for defining and communicating engineering tolerances. It uses a symbolic language on engineering drawings and computer-generated three-dimensional solid models that explicitly describes nominal geometry and its allowable variation. It tells the manufacturing staff and machines what degree of accuracy and precision is needed on each controlled feature of the part. GD&T is used to define the nominal (theoretically perfect) geometry of parts and assemblies, to define the allowable variation in form and possible size of individual features, and to define the allowable variation between features." [Geometric dimensioning and tolerancing. Wikipedia]
The shapes example "Design elements - Dimensioning and tolerancing" was created using the ConceptDraw PRO diagramming and vector drawing software extended with the Mechanical Engineering solution from the ConceptDraw Solution Park.
Dimensioning and tolerancing symbols
The vector stencils library "Solid geometry" contains 15 shapes of solid geometric figures.
"In mathematics, solid geometry was the traditional name for the geometry of three-dimensional Euclidean space - for practical purposes the kind of space we live in. It was developed following the development of plane geometry. Stereometry deals with the measurements of volumes of various solid figures including cylinder, circular cone, truncated cone, sphere, and prisms.
The Pythagoreans had dealt with the regular solids, but the pyramid, prism, cone and cylinder were not studied until the Platonists. Eudoxus established their measurement, proving the pyramid and cone to have one-third the volume of a prism and cylinder on the same base and of the same height, and was probably the discoverer of a proof that the volume of a sphere is proportional to the cube of its radius." [Solid geometry. Wikipedia]
The shapes example "Design elements - Solid geometry" was created using the ConceptDraw PRO diagramming and vector drawing software extended with the Mathematics solution from the Science and Education area of ConceptDraw Solution Park.
Solid geometrical figures
Mac Compatible Remote Presentation


Interior Design Software. Building Plan Examples

Technical Drawings

Mathematical Diagrams

Use this mathematical drawings and graphs template to create your own math illustrations using the shapes of plane and solid geometric figures as well as trigonometric functions.
"Mathematical visualization or mathematical visualization is an aspect of geometry which allows one to understand and explore mathematical phenomena via visualization. Classically this consisted of two-dimensional drawings or building three-dimensional models (particularly plaster models in the 19th and early 20th century), while today it most frequently consists of using computers to make static two or three dimensional drawings, animations, or interactive programs. Writing programs to visualize mathematics is an aspect of computational geometry." [Mathematical visualization. Wikipedia]
The math illustrations template for the ConceptDraw PRO diagramming and vector drawing software is included in the Mathematics solution from the Science and Education area of ConceptDraw Solution Park.
Mathematical drawings and graphs
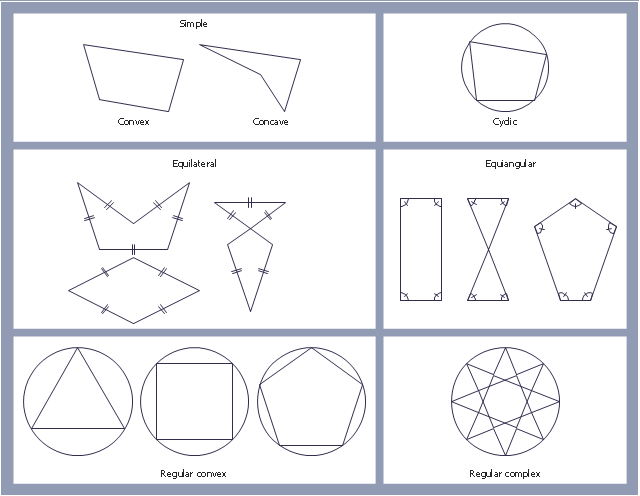
"In geometry a polygon is traditionally a plane figure that is bounded by a finite chain of straight line segments closing in a loop to form a closed chain or circuit. These segments are called its edges or sides, and the points where two edges meet are the polygon's vertices (singular: vertex) or corners. The interior of the polygon is sometimes called its body. An n-gon is a polygon with n sides. A polygon is a 2-dimensional example of the more general polytope in any number of dimensions. ...
The basic geometrical notion has been adapted in various ways to suit particular purposes. Mathematicians are often concerned only with the bounding closed polygonal chain and with simple polygons which do not self-intersect, and they often define a polygon accordingly. A polygonal boundary may be allowed to intersect itself, creating star polygons. Geometrically two edges meeting at a corner are required to form an angle that is not straight (180°); otherwise, the line segments may be considered parts of a single edge; however mathematically, such corners may sometimes be allowed. These and other generalizations of polygons are described below." [Polygon. Wikipedia]
The geometry diagram example "Polygon types" was created using the ConceptDraw PRO diagramming and vector drawing software extended with the Mathematics solution from the Science and Education area of ConceptDraw Solution Park.
Polygon types
The vector stencils library "Dimensioning" contains 18 dimensions shapes.
Use it to create your landscape design and garden plans.
"Geometric dimensioning and tolerancing (GD&T) is a system for defining and communicating engineering tolerances. It uses a symbolic language on engineering drawings and computer-generated three-dimensional solid models that explicitly describes nominal geometry and its allowable variation. It tells the manufacturing staff and machines what degree of accuracy and precision is needed on each controlled feature of the part. GD&T is used to define the nominal (theoretically perfect) geometry of parts and assemblies, to define the allowable variation in form and possible size of individual features, and to define the allowable variation between features.
Dimensioning specifications define the nominal, as-modeled or as-intended geometry. One example is a basic dimension." [Geometric dimensioning and tolerancing. Wikipedia]
The dimensions shapes example "Design elements - Dimensioning" was created using the ConceptDraw PRO diagramming and vector drawing software extended with the Landscape & Garden solution from the Building Plans area of ConceptDraw Solution Park.
Dimension shapes
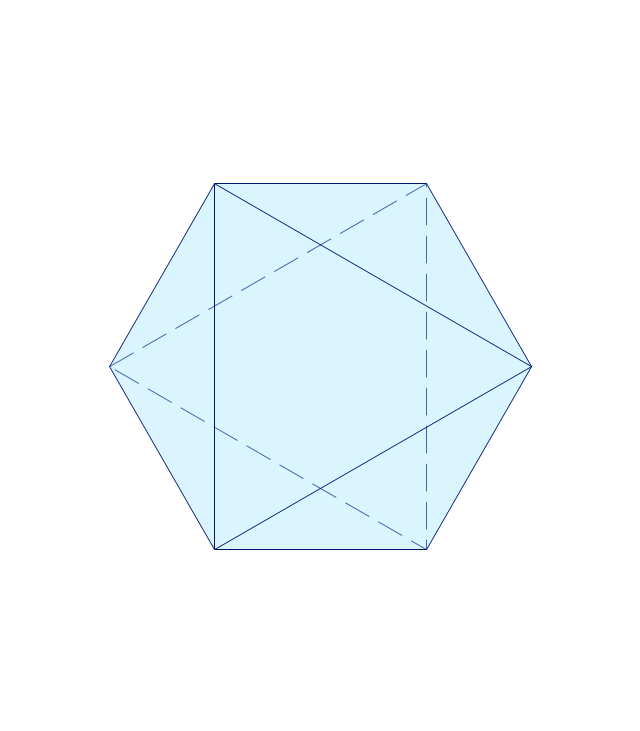
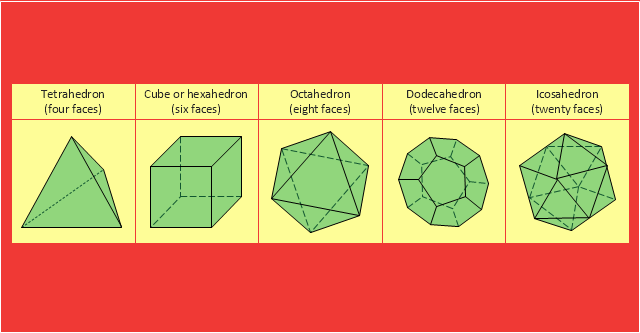
"In Euclidean geometry, a Platonic solid is a regular, convex polyhedron with congruent faces of regular polygons and the same number of faces meeting at each vertex. Five solids meet those criteria, and each is named after its number of faces.
Geometers have studied the mathematical beauty and symmetry of the Platonic solids for thousands of years. They are named for the ancient Greek philosopher Plato who theorized in his dialogue, the Timaeus, that the classical elements were made of these regular solids." [Platonic solid. Wikipedia]
The geometry diagram example "Platonic solid" was created using the ConceptDraw PRO diagramming and vector drawing software extended with the Mathematics solution from the Science and Education area of ConceptDraw Solution Park.
Platonic solids
The vector stencils library "Dimensioning and tolerancing" contains 45 symbols of geometric dimensions and mechanical tolerances, geometric symbols, callouts, and text boxes and inserts.
Use these geometric dimensioning and tolerancing (GD&T) shapes to create annotated mechanical drawings in the ConceptDraw PRO diagramming and vector drawing software extended with the Mechanical Engineering solution from the Engineering area of ConceptDraw Solution Park.
www.conceptdraw.com/ solution-park/ engineering-mechanical
Datum (old)
-dimensioning-and-tolerancing---vector-stencils-library.png--diagram-flowchart-example.png)
Box callout
Datum symbol
Callout

All around callout

Text block

2 datum frame

Simple frame

Basic frame

1 datum frame

3 datum frame
Straightness

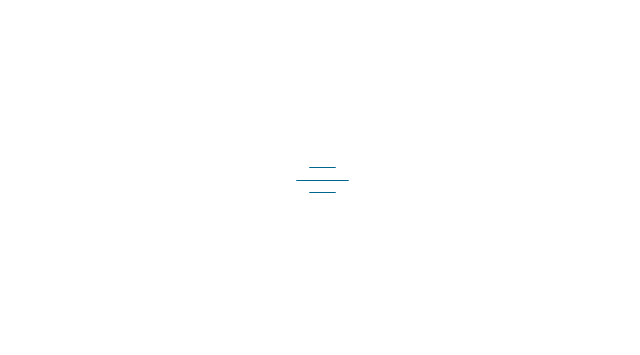
Flatness

Line profile

Circularity

Cylindricity

Surface profile

Position

Concentricity

Symmetry
Parallelism

Perpendicularity
Angularity

Material condition

Arc length

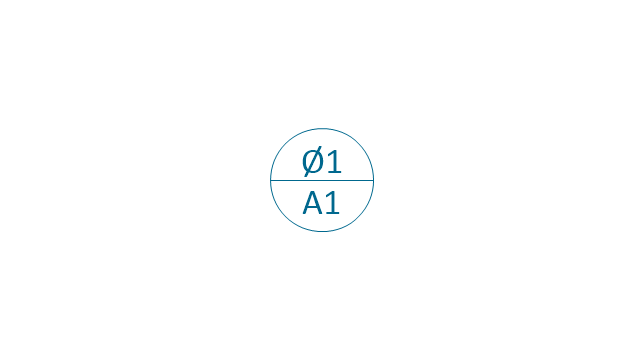
Diameter

Counterbore/ spotface

Countersink

Depth

Slope
Conical taper
Statistical tolerance

Datum (new)
-dimensioning-and-tolerancing---vector-stencils-library.png--diagram-flowchart-example.png)
Datum (new) 2
-2-dimensioning-and-tolerancing---vector-stencils-library.png--diagram-flowchart-example.png)
Target point
Target line
Target area (circle)
-dimensioning-and-tolerancing---vector-stencils-library.png--diagram-flowchart-example.png)
Target area (rectangle)
-dimensioning-and-tolerancing---vector-stencils-library.png--diagram-flowchart-example.png)
Total runout

Total runout 2
Circular runout
Circular runout 2

Surface finish

Surface finish, removal process

Surface finish, no process permitted

How To use Switches in Network Diagram


- Ice Hockey | Basic Diagrams Of Geometry With Names
- Solid geometry | Tetrahedral Geometry Diagrams Using Solids
- Butt weld geometry | Mathematics | Types Of Geometry Diagrams
- Design elements - Solid geometry | Sketch The Following ...
- How to Draw Geometric Shapes | Solid geometry - Vector stencils ...
- Solid geometry - Vector stencils library | Diagram Of Tetrahedra ...
- Design elements - Solid geometry | Good Geometrical Figures
- Mathematical Diagrams | Basic Geometry Diagrams In Math
- Mathematics Symbols | Mathematical Diagrams | Scientific Symbols ...
- Mathematics Symbols | How to Draw Geometric Shapes in ...