Mathematics Symbols

 Mathematics
Mathematics solution extends ConceptDraw PRO software with templates, samples and libraries of vector stencils for drawing the mathematical illustrations, diagrams and charts.
Mathematical Diagrams

Basic Diagramming


Cylinder Venn Diagram

Physics Symbols

2 Circle Venn Diagram. Venn Diagram Example

Scientific Symbols Chart

Mathematics Solution from the Science and Education area of ConceptDraw Solution Park includes a few shape libraries of plane, solid geometric figures, trigonometrical functions and greek letters to help you create different professional looking mathematic illustrations for science and education.
Basic Circles Venn Diagram. Venn Diagram Example

3 Circle Venn. Venn Diagram Example

"In mathematics, the Euclidean algorithm, or Euclid's algorithm, is a method for computing the greatest common divisor (GCD) of two (usually positive) integers, also known as the greatest common factor (GCF) or highest common factor (HCF). ...
The GCD of two positive integers is the largest integer that divides both of them without leaving a remainder (the GCD of two integers in general is defined in a more subtle way).
In its simplest form, Euclid's algorithm starts with a pair of positive integers, and forms a new pair that consists of the smaller number and the difference between the larger and smaller numbers. The process repeats until the numbers in the pair are equal. That number then is the greatest common divisor of the original pair of integers.
The main principle is that the GCD does not change if the smaller number is subtracted from the larger number. ... Since the larger of the two numbers is reduced, repeating this process gives successively smaller numbers, so this repetition will necessarily stop sooner or later - when the numbers are equal (if the process is attempted once more, one of the numbers will become 0)." [Euclidean algorithm. Wikipedia]
The flowchart example "Euclidean algorithm" was created using the ConceptDraw PRO diagramming and vector drawing software extended with the Mathematics solution from the Science and Education area of ConceptDraw Solution Park.
Euclid's algorithm flow chart

3 Circle Venn Diagram. Venn Diagram Example

Circles Venn Diagram

Exam Preparation Mind Map

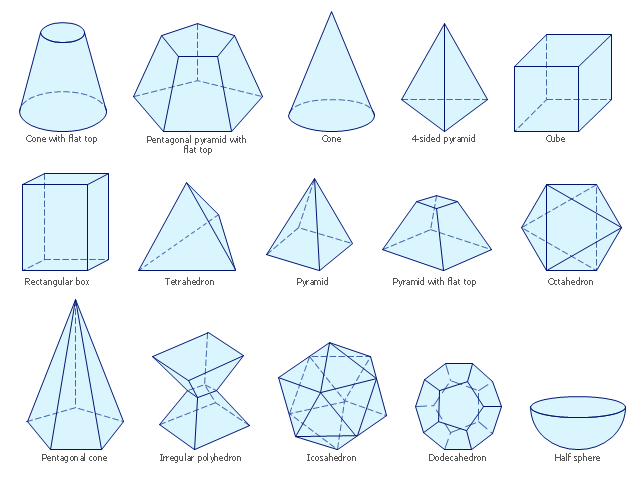
The vector stencils library "Solid geometry" contains 15 shapes of solid geometric figures.
"In mathematics, solid geometry was the traditional name for the geometry of three-dimensional Euclidean space - for practical purposes the kind of space we live in. It was developed following the development of plane geometry. Stereometry deals with the measurements of volumes of various solid figures including cylinder, circular cone, truncated cone, sphere, and prisms.
The Pythagoreans had dealt with the regular solids, but the pyramid, prism, cone and cylinder were not studied until the Platonists. Eudoxus established their measurement, proving the pyramid and cone to have one-third the volume of a prism and cylinder on the same base and of the same height, and was probably the discoverer of a proof that the volume of a sphere is proportional to the cube of its radius." [Solid geometry. Wikipedia]
The shapes example "Design elements - Solid geometry" was created using the ConceptDraw PRO diagramming and vector drawing software extended with the Mathematics solution from the Science and Education area of ConceptDraw Solution Park.
Solid geometrical figures
- Mathematical Diagrams | Mathematics Symbols | Basic ...
- Mathematical Diagrams | Basic Diagramming | Mathematics ...
- Basic Diagramming | Mathematics | Euclidean algorithm - Flowchart ...
- Mathematics Symbols | Mathematical Diagrams | Math illustrations ...
- Mathematical Illustrations Template
- Mathematical Diagrams | Physics Symbols | Mathematics Symbols ...
- Mathematics Symbols | Scientific Symbols Chart | How to Draw ...
- Mathematics | Mathematics Symbols | Mathematical Diagrams ...
- Solving quadratic equation algorithm - Flowchart | Mathematics ...
- Basic Flowchart Symbols and Meaning | Mathematics | Basic ...
- Topology Mathematics Symbols Chart
- Mathematics Symbols | The Best Choice for Creating Diagram ...
- Exam Preparation Mind Map | Basic Diagramming | Mathematics ...
- Mathematics Symbols | Scientific Symbols Chart | Mathematics ...
- Mathematical Diagrams | Mathematics Symbols | Mathematics ...
- Basic Flowchart Symbols and Meaning | Mathematics Symbols ...
- Mathematics Symbols | Mathematical Diagrams | Mathematics ...
- Mathematical Diagrams | Mathematics Symbols | Management Tools ...
- Mathematical Diagrams | Mathematics | Mathematics Symbols ...