A customer's expectation of a particular service is determined by factors such as recommendations, personal needs and past experiences. The expected service and the perceived service sometimes may not be equal, thus leaving a gap. The service quality model or the ‘GAP model’ developed by a group of authors- Parasuraman, Zeithaml and Berry at Texas and North Carolina in 1985 , highlights the main requirements for delivering high service quality. It identifies five ‘gaps’ that cause unsuccessful delivery. Customers generally have a tendency to compare the service they 'experience' with the service they 'expect' . If the experience does not match the expectation , there arises a gap. Ten determinants that may influence the appearance of a gap were described by Parasuraman, Zeithaml and Berry. in the SERVQUAL model: reliability, responsiveness, competence, access, courtesy, communication, credibility, security, understanding the customer and tangibles.
Later, the determinants were reduced to five: tangibles; reliability; responsiveness; service assurance and empathy in the so called RATER model." [Service quality. Wikipedia]
The block diagram example "Gap model of service quality" was created using the ConceptDraw PRO diagramming and vector drawing software extended with the Block Diagrams solution from the area "What is a Diagram" of ConceptDraw Solution Park.

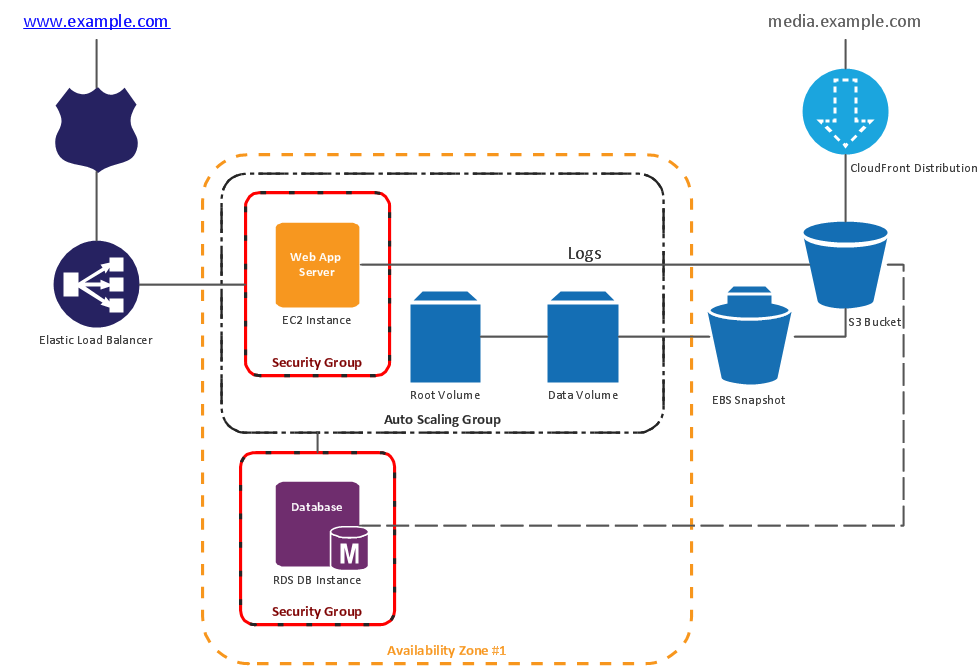
Context Diagram Template

This template shows the Context Diagram. It was created in ConceptDraw DIAGRAM diagramming and vector drawing software using the Block Diagrams Solution from the “Diagrams” area of ConceptDraw Solution Park.
The context diagram graphically identifies the system. external factors, and relations between them. It’s a high level view of the system. The context diagrams are widely used in software engineering and systems engineering for designing the systems that process the information.
 Seven Basic Tools of Quality
Making Diagrams Has Never Been Easier
Flowchart Software

ConceptDraw DIAGRAM flowchart software will help to quickly create new flowcharts, workflow, NS Diagram, BPMN Diagram, Cross-functional flowcharts, data flow diagrams and highlight flowcharts.
Feature-rich flowchart maker, free thousand flowchart examples and templates and colored symbols that will allow you to create professional looking flowcharts simply.
ConceptDraw DIAGRAM supports macOS and Windows.

 Workflow Diagrams
ConceptDraw Arrows10 Technology
How should diagramming software work? Is it possible to develop a diagram as quickly as the ideas come to you? The innovative Auto-connection mode is what you need to start draw.
Examples Flowchart

ConceptDraw DIAGRAM diagramming and vector drawing software provides the unique Flowcharts Solution from the "Diagrams" Area of ConceptDraw Solution Park with variety of vector objects libraries and collection of examples Flowchart. Each example flowchart included in Flowcharts solution is a real help in drawing process, it can be the good base or perfect source of inspiration.
Business Tools Perceptual Mapping

Perception Mapping helps organizations measure and transform all aspects of their business, people and culture. Perception Mapping allows to represent the complex relationships graphically, helps identify potential problems of the organization and make the best decisions.
Workflow Diagram Examples
 Matrices
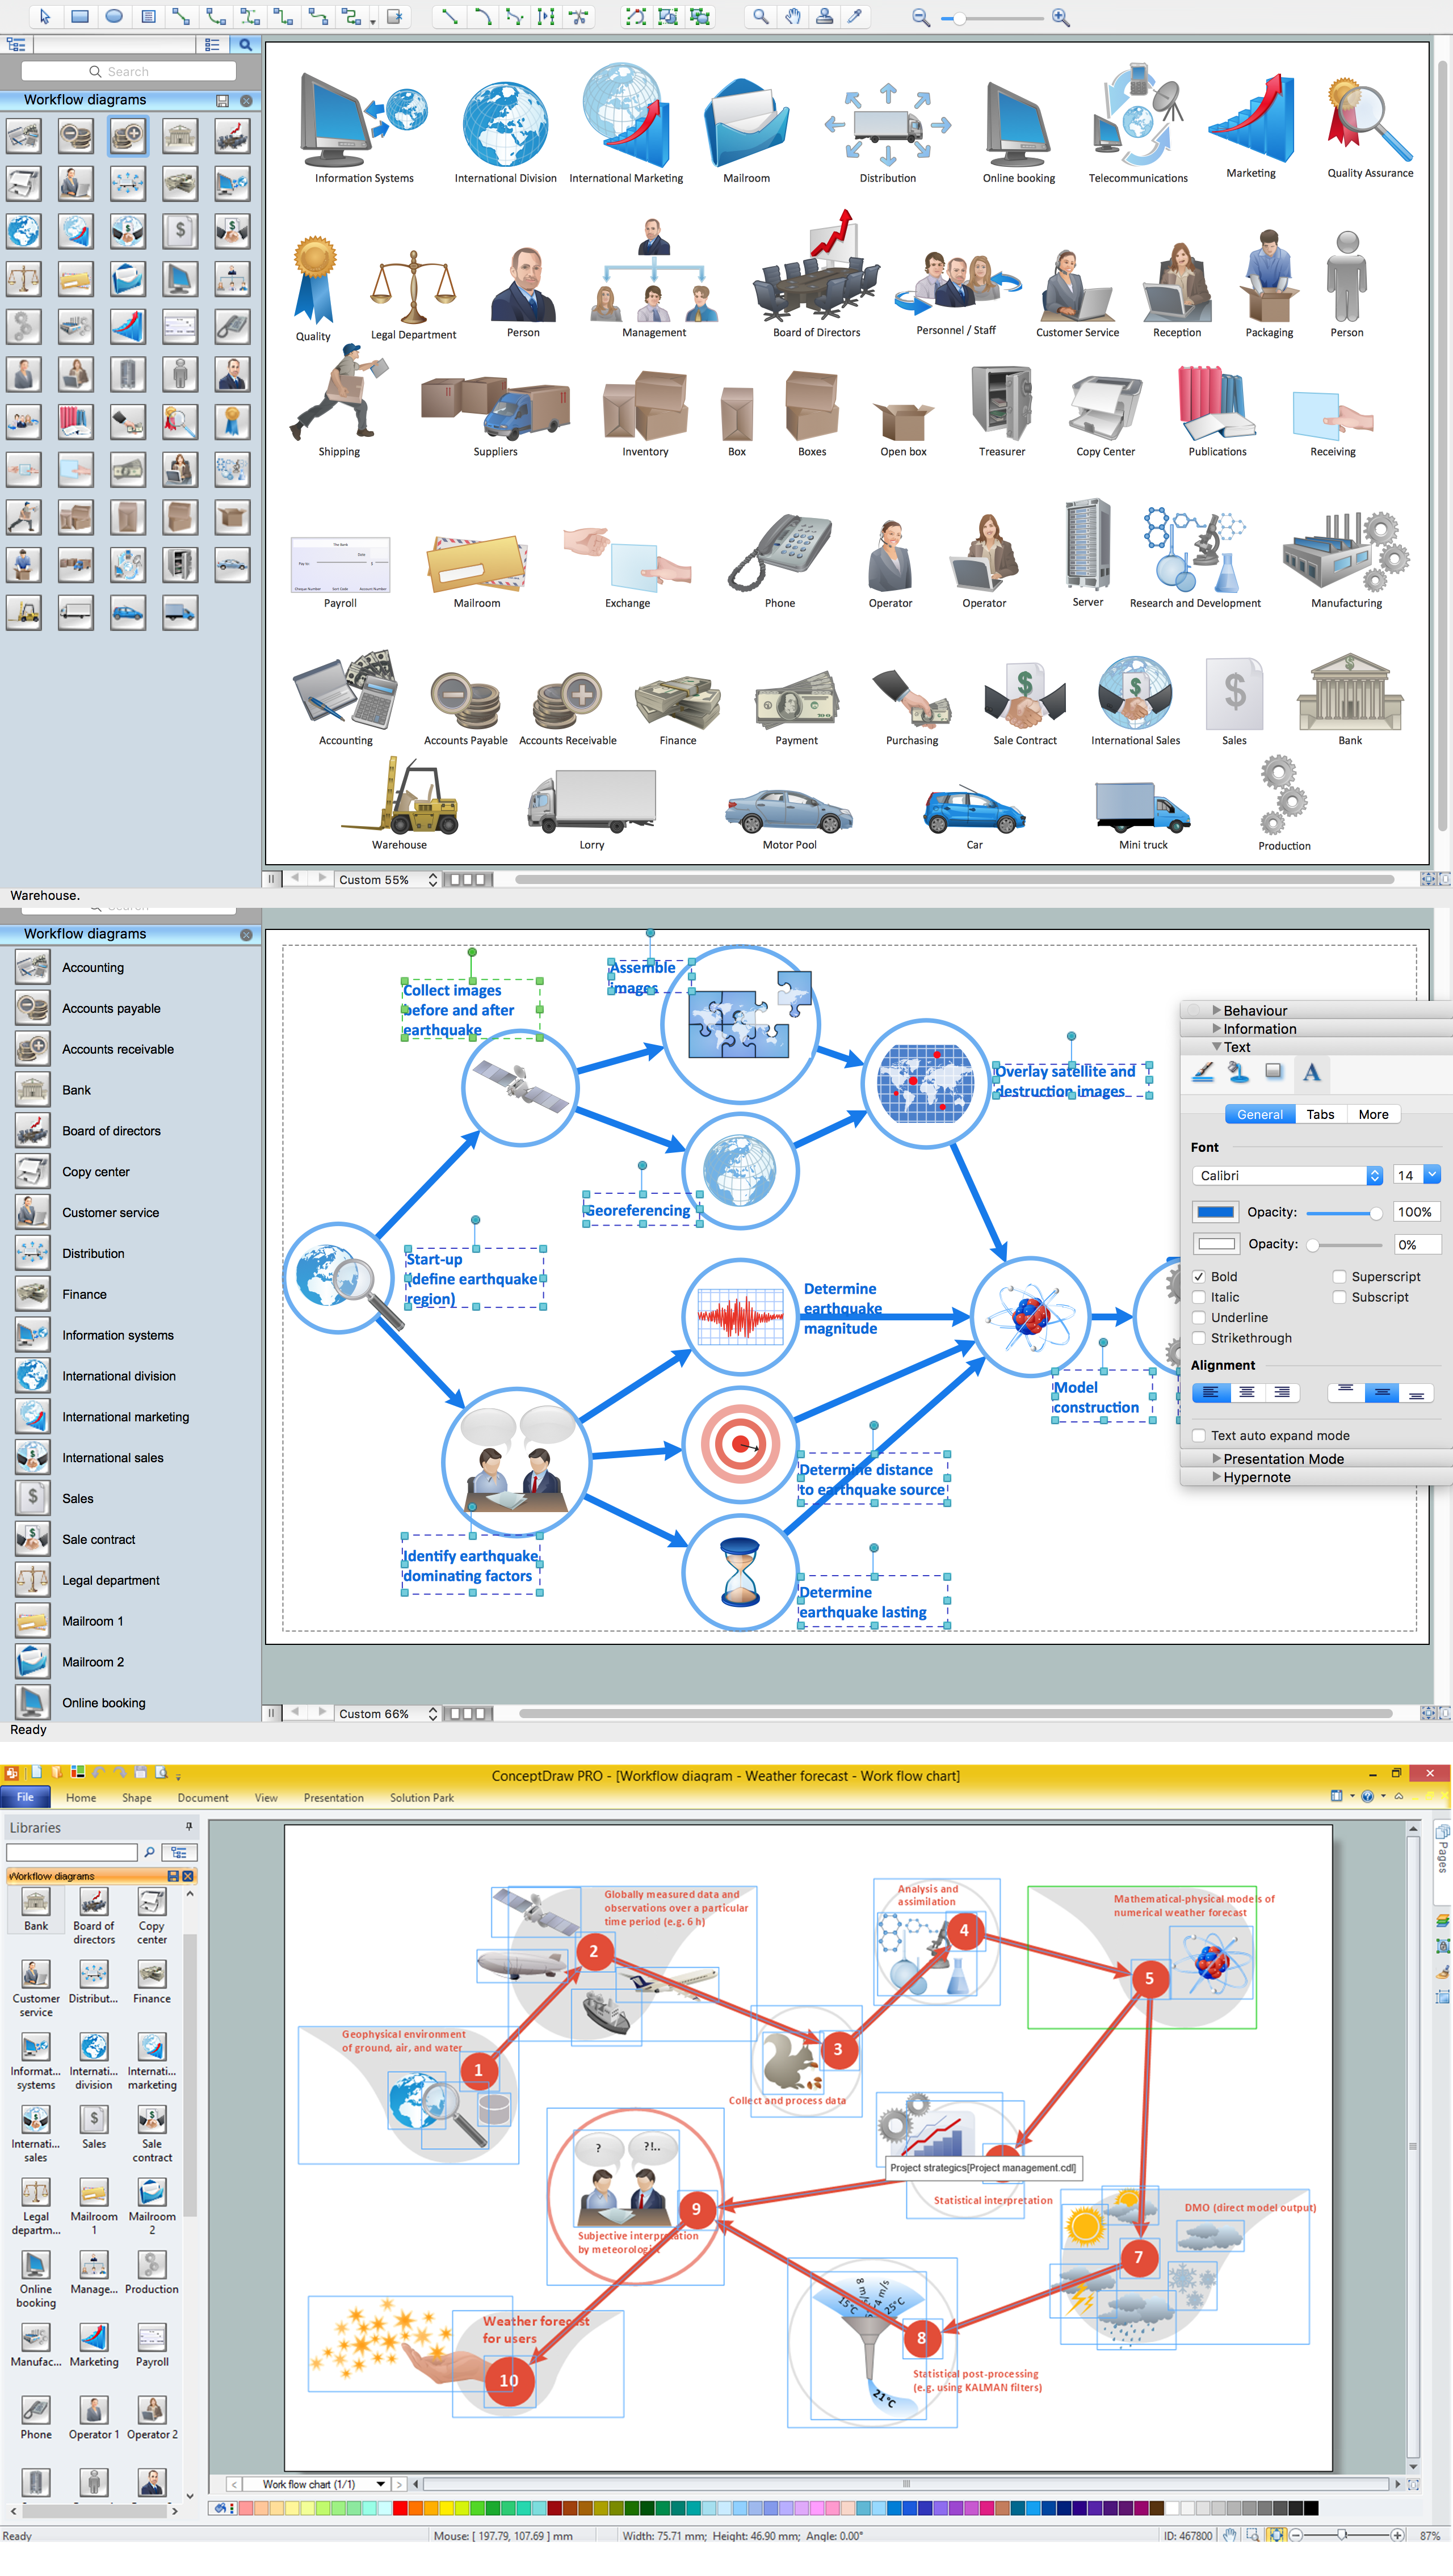
Workflow Diagram Software Mac

Use the ConceptDraw DIAGRAM professional Mac OS X software for drawing workflow diagram. The Workflow Diagrams solution with its libraries and templates set make the possibility to identify resources that are required for work goal implementation. The process flow diagram identify flow which occurs as network of process dependencies, organizational decisions and interactions between departments. Usually workflow diagrams show business participants actions that carry product or service to the final destination, the consumer.
Competitor Analysis

 Basic Floor Plans
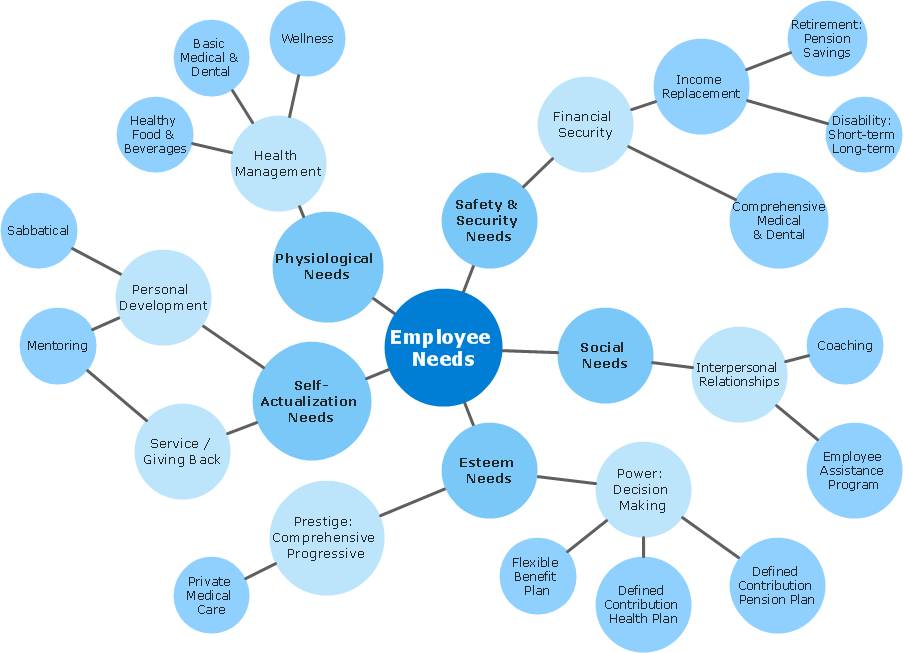
Mind Maps for Business - SWOT Analysis

- Quality Assurance Block Diagram
- Block Diagram Of Quality Assurance
- Block Diagram Of Quality Control
- Block Diagram In Quality Control
- What Is Meant By Quality Assurance With Block Diagram
- Total Quality Management TQM Diagrams
- Seven Basic Tools of Quality - Quality Control | Workflow Diagram ...
- Top 5 Android Flow Chart Apps | Functional Block Diagram | Basic ...
- Mind Map Quality Assurance Diagram
- Process Flowchart | Event-Driven Process Chain Diagram Software ...
- UML Block Diagram | Block Diagrams | How to Draw a Block ...
- Total Quality Management Value | Fishbone Diagram Problem ...
- Quality Assurance Process Flow Diagrams
- Quality Assurance
- Block diagram - Gap model of service quality | Block Diagram ...
- Block Diagram Of Quality Control Tools
- Quality Assurance Visio Business Flow Image
- Block diagram - Gap model of service quality | Process Flowchart ...
- Process Flowchart | TQM Software — Build Professional TQM ...
- Block diagram - Gap model of service quality | Model Based ...
- ERD | Entity Relationship Diagrams, ERD Software for Mac and Win
- Flowchart | Basic Flowchart Symbols and Meaning
- Flowchart | Flowchart Design - Symbols, Shapes, Stencils and Icons
- Flowchart | Flow Chart Symbols
- Electrical | Electrical Drawing - Wiring and Circuits Schematics
- Flowchart | Common Flowchart Symbols
- Flowchart | Common Flowchart Symbols