Total Quality Management Value

Fishbone Diagram Problem Solving

To design easily the Fishbone diagram, you can use a special ConceptDraw DIAGRAM vector graphic and diagramming software which contains the powerful tools for Fishbone diagram problem solving offered by Fishbone Diagrams solution for the Management area of ConceptDraw Solution Park.
Seven Basic Tools of Quality — Quality Control

 Seven Basic Tools of Quality
Manage quality control in the workplace, using fishbone diagrams, flowcharts, Pareto charts and histograms, provided by the Seven Basic Tools of Quality solution.
Competitor Analysis

Flowchart Software

ConceptDraw DIAGRAM flowchart software will help to quickly create new flowcharts, workflow, NS Diagram, BPMN Diagram, Cross-functional flowcharts, data flow diagrams and highlight flowcharts.
Feature-rich flowchart maker, free thousand flowchart examples and templates and colored symbols that will allow you to create professional looking flowcharts simply.
ConceptDraw DIAGRAM supports macOS and Windows.

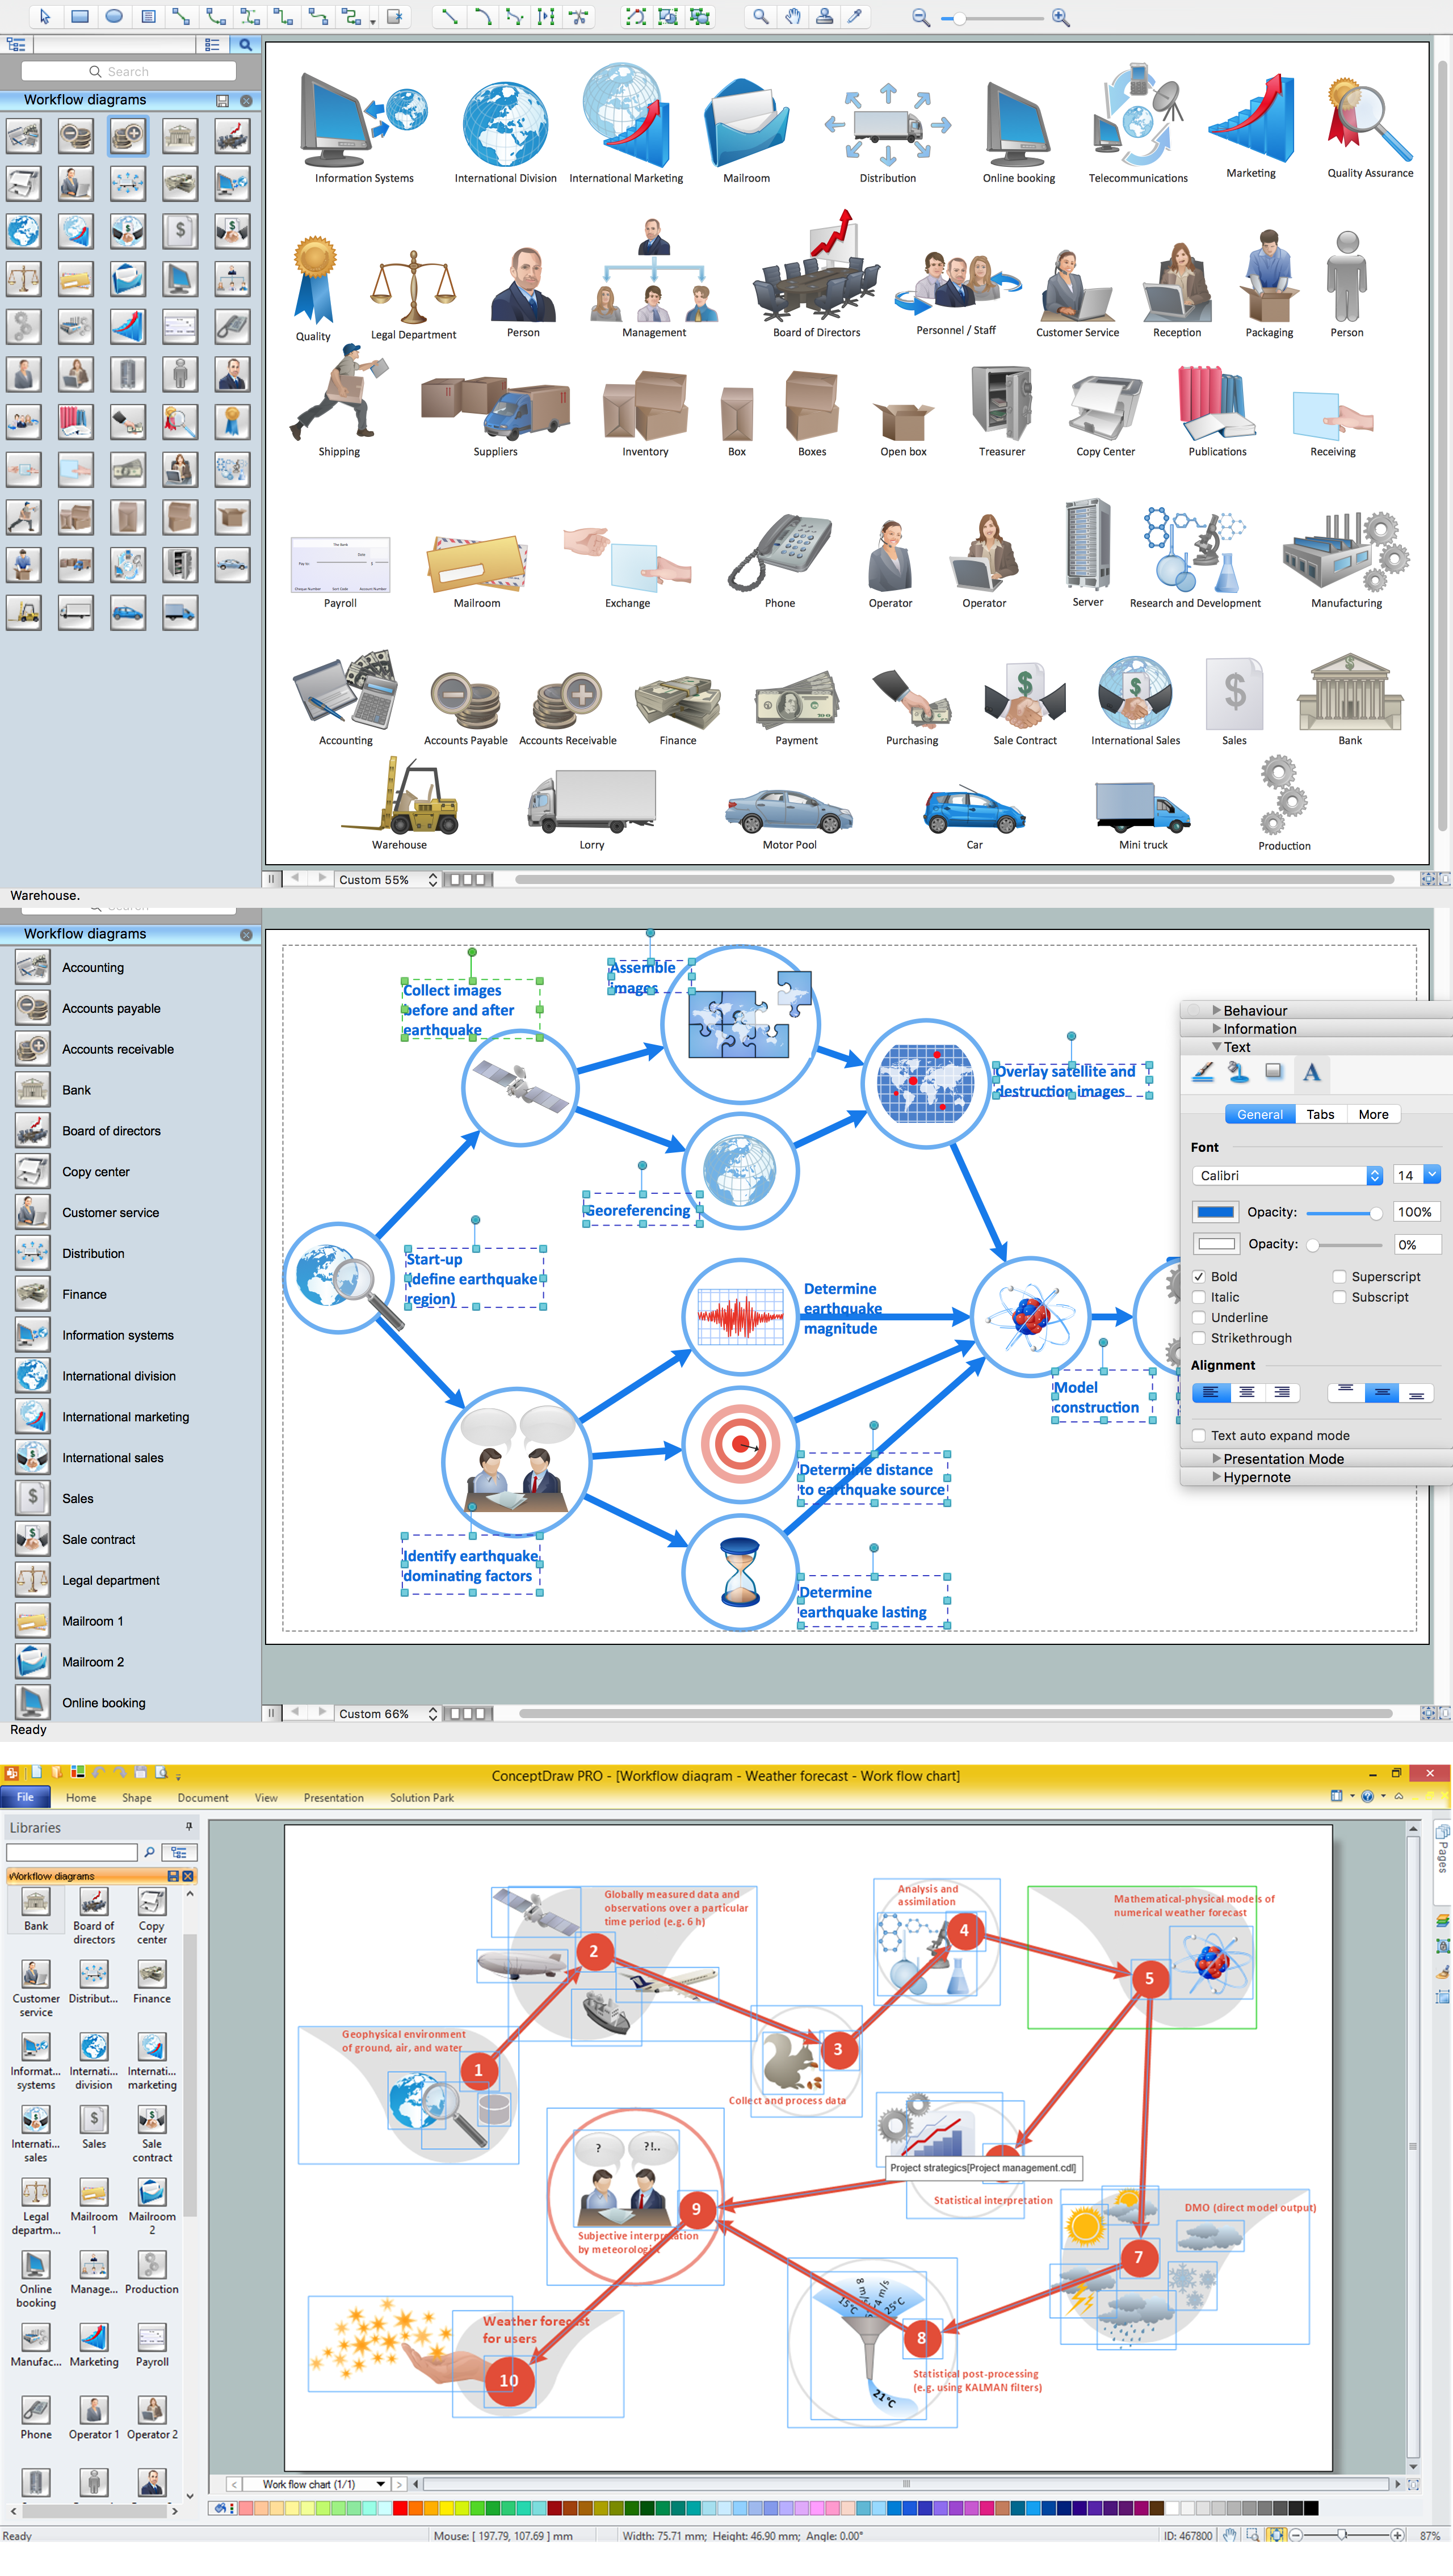
 Workflow Diagrams
Workflow Diagrams solution extends ConceptDraw DIAGRAM software with samples, templates and vector stencils library for drawing the work process flowcharts.
Workflow Diagram Examples
 Matrices
This solution extends ConceptDraw DIAGRAM software with samples, templates and library of design elements for drawing the business matrix diagrams.
 Basic Floor Plans
Detailed floor plan is the basis of any building project, whether a home, office, business center, restaurant, shop store, or any other building or premise. Basic Floor Plans solution is a perfect tool to visualize your creative projects, architectural and floor plans ideas.
SWOT Matrix Template

- When To Use a Fishbone Diagram | How Do Fishbone Diagrams ...
- Cause and Effect Analysis - Fishbone Diagrams for Problem Solving ...
- Total Quality Management Value | Probability Quality Control Tools ...
- Probability Quality Control Tools | Cause and Effect Analysis ...
- Total Quality Management Value | Fishbone Diagram Problem ...
- Seven Basic Tools of Quality - Quality Control | Workflow Diagram ...
- Quality Assurance Chart
- Total Quality Management TQM Diagrams
- Quality Assurance Process Flow Diagrams
- Quality Mind Map | TQM Diagram Example | Fishbone Diagram ...
- Probability Quality Control Tools | ERD Symbols and Meanings ...
- Quality Assurance Block Diagram
- Process flowchart - QA processes in HSRU | Seven Basic Tools of ...
- What Is Meant By Quality Assurance With Block Diagram
- Probability Quality Control Tools | Seven Basic Tools of Quality ...
- Mechanical Engineering Quality Assurance Symbol
- Project Qa Workflow
- Seven Basic Tools of Quality - Quality Control | Total Quality ...
- Organizational Structure Total Quality Management | Quality issues ...
- Quality Mind Map | TQM Diagram Example | Group Collaboration ...
- ERD | Entity Relationship Diagrams, ERD Software for Mac and Win
- Flowchart | Basic Flowchart Symbols and Meaning
- Flowchart | Flowchart Design - Symbols, Shapes, Stencils and Icons
- Flowchart | Flow Chart Symbols
- Electrical | Electrical Drawing - Wiring and Circuits Schematics
- Flowchart | Common Flowchart Symbols
- Flowchart | Common Flowchart Symbols