 Quality Mind Map
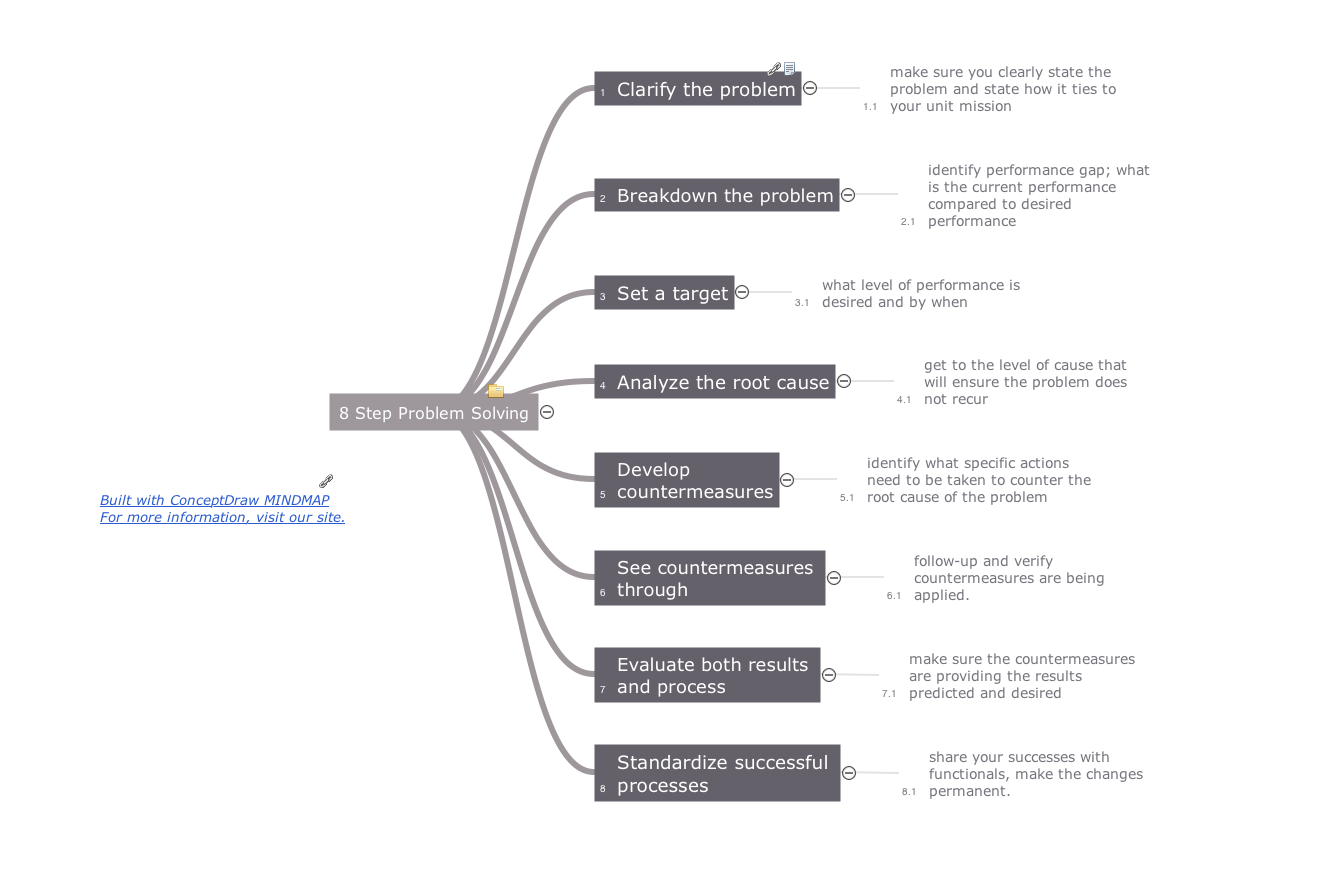
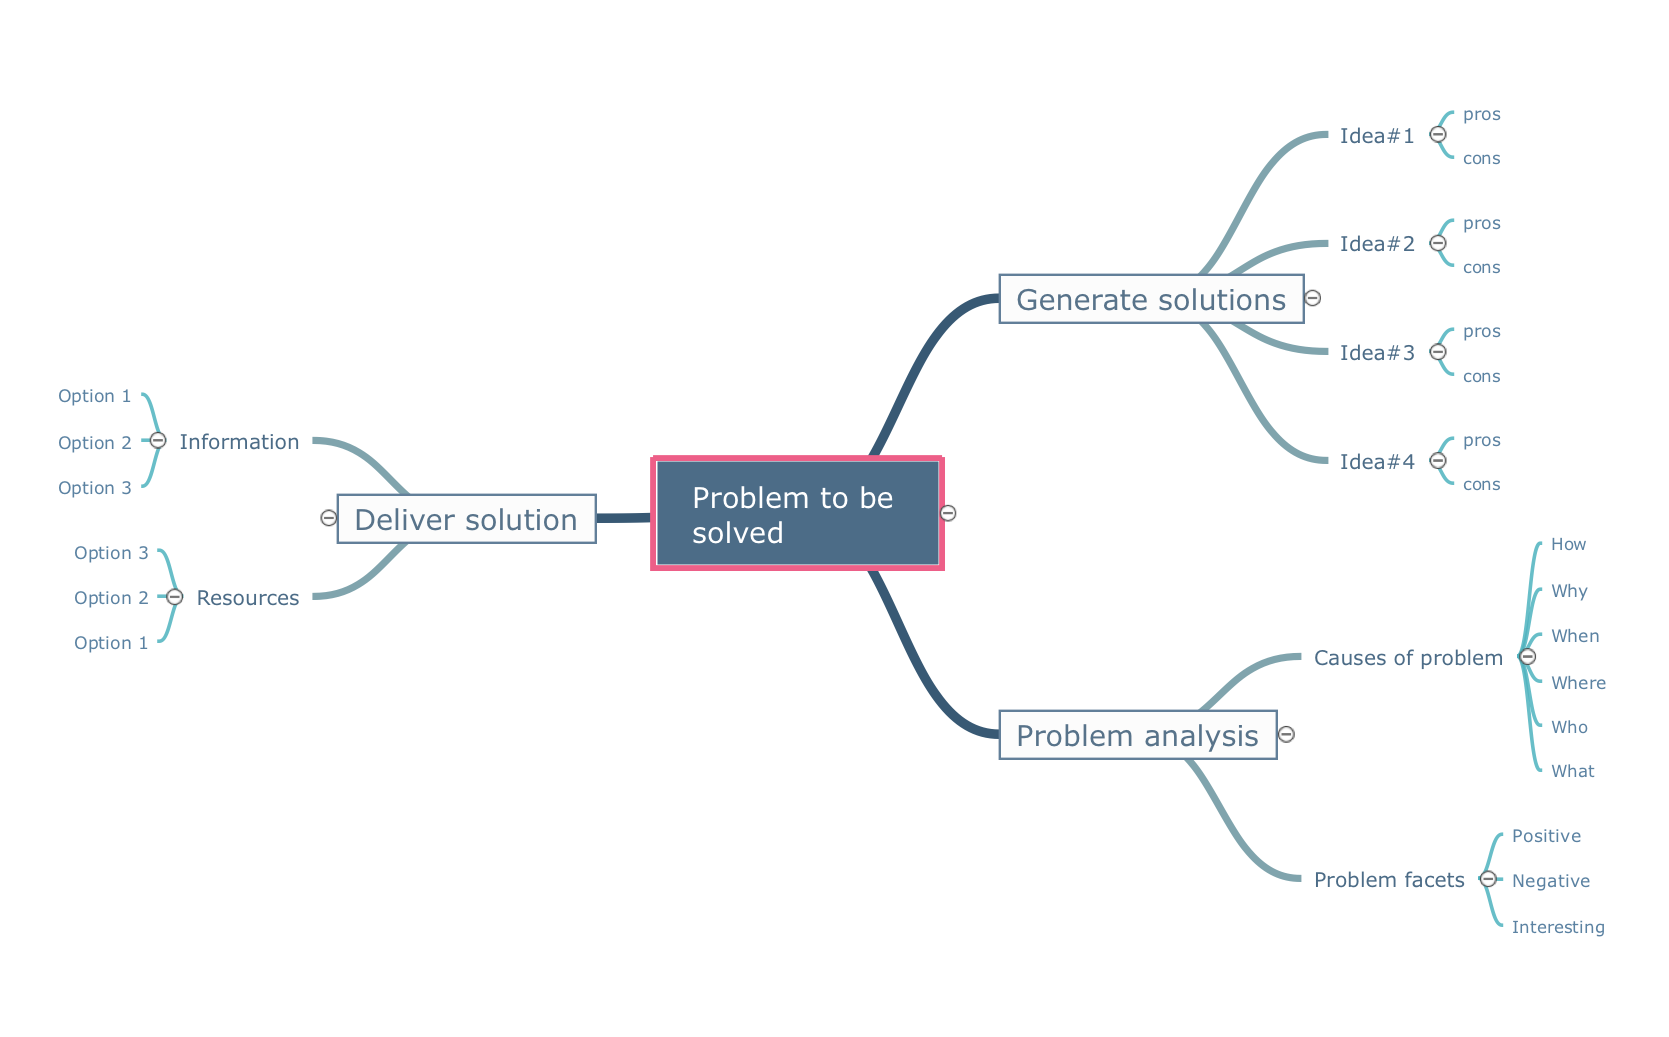
This solution extends ConceptDraw MINDMAP software with Quality Management Mind Maps (Presentations, Meeting Agendas, Problem to be solved).
TQM Diagram Example

How Do Fishbone Diagrams Solve Manufacturing Problems

Quality Management Teams
Cause and Effect Analysis - Fishbone Diagrams for Problem Solving

 Seven Basic Tools of Quality
Manage quality control in the workplace, using fishbone diagrams, flowcharts, Pareto charts and histograms, provided by the Seven Basic Tools of Quality solution.
A Creative Look at Quality Procedures
Quality Project Management with Mind Maps

TQM Diagram — Professional Total Quality Management

Mind Mapping in the Quality Management
- Quality Mind Map | Quality Problems Examples
- Quality Problem Example
- Cause and Effect Analysis - Fishbone Diagrams for Problem Solving ...
- Example Of Case And Effect Diagram For Quality Problem In Metal ...
- Fishbone Diagrams | Fish Bone Diagram In Quality Management
- Problem solving | Fishbone Diagram Problem Solving | Using ...
- Fishbone Diagrams | Fishbone diagram - Causes of low- quality ...
- Problem Solution Map Examples
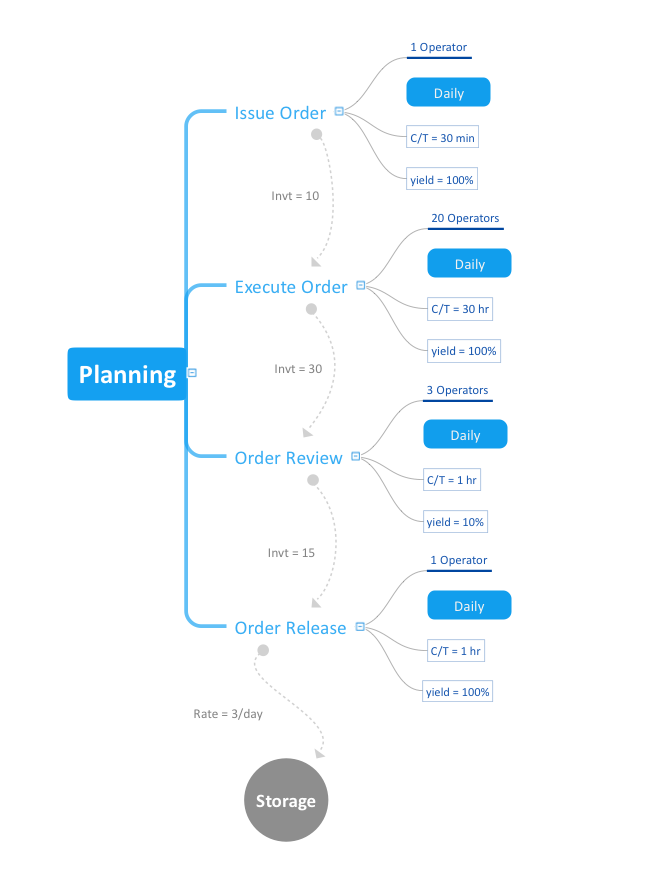
- Quality Control | Value-Stream Mapping for Manufacturing | TQM ...