Seven Basic Tools of Quality — Quality Control

 Seven Basic Tools of Quality
Manage quality control in the workplace, using fishbone diagrams, flowcharts, Pareto charts and histograms, provided by the Seven Basic Tools of Quality solution.
Total Quality Management Value

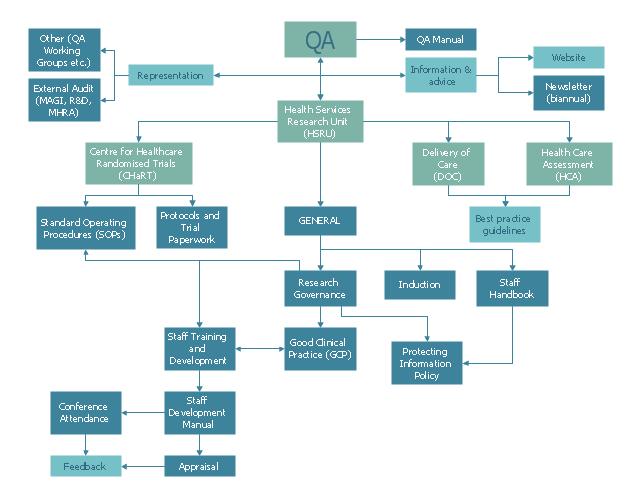
This example was created on the base of QA flowchart from the website of the Health Services Research Unit (HSRU), University of Aberdeen. [abdn.ac.uk/ hsru/ research/ quality/ qa-documents/ ]
"Quality assurance (QA) is a way of preventing mistakes or defects in manufactured products and avoiding problems when delivering solutions or services to customers...
QA is very important in the medical field because it helps to identify the standards of medical equipments and services. Hospitals and laboratories make use of external agencies in order to ensure standards for equipment such as X-ray machines, Diagnostic Radiology and AERB." [Quality assurance. Wikipedia]
The example "Process flowchart - QA processes in HSRU" was created using the ConceptDraw PRO software extended with the Seven Basic Tools of Quality solution from the Quality area of ConceptDraw Solution Park.
Flow chart example
Competitor Analysis

Fishbone Diagram Problem Solving

The vector stencils library "Sales department" contains 49 company department icons.
Use these sales pictograms to draw your sales flowcharts, workflow diagrams and process charts with the ConceptDraw PRO diagramming and vector drawing software.
The vector stencils library "Sales department" is included in the Sales Flowcharts solution from the Marketing area of ConceptDraw Solution Park.
Accounting

Accounts payable

Accounts receivable

Audit

Bank

Board of directors

Copy center

Customer service operator

Customer service technician

Data center

Delivery

Design

Devices management

Distribution

Distribution

Employee

Engineering

Facilities

Finance

Human resource

Devices management

Information systems

International division

International marketing

International sales

Inventory

Legal department

Mail room

Mail service

Management

Manufacturing

Marketing

Motorpool

Online service

Packaging

Payroll

Publications

Purchasing

Quality assurance

Receiving

Reception

Research and development

Sales growth

Scales

Security

Shipping

Suppliers

Telecommunication

Warehouse

Business Tools Perceptual Mapping

The vector stencils library "Workflow diagrams" contains 54 symbol icons of workflow diagrams.
Use these clipart to represent information flow, automation of business processes, business process re-engineering, accounting, management, and human resources tasks in industry, business, and manufacturing.
"The term workflow is more commonly used in particular industries, such as printing and professional domains, where it may have particular specialized meanings.
(1) Processes: A process is a more general notion than workflow and can apply to physical or biological processes, for instance; whereas a workflow is typically a process or collection of processes described in the context of work, such as all processes occurring in a machine shop.
(2) Planning and scheduling: A plan is a description of the logically necessary, partially ordered set of activities required to accomplish a specific goal given certain starting conditions. A plan, when augmented with a schedule and resource allocation calculations, completely defines a particular instance of systematic processing in pursuit of a goal. A workflow may be viewed as an (often optimal or near-optimal) realization of the mechanisms required to execute the same plan repeatedly.
(3) Flow control is a control concept applied to workflows, to distinguish from static control of buffers of material or orders, to mean a more dynamic control of flow speed and flow volumes in motion and in process. Such orientation to dynamic aspects is the basic foundation to prepare for more advanced job shop controls, such as just-in-time or just-in-sequence.
(4) In-transit visibility is a monitoring concept that applies to transported material as well as to work in process or work in progress, i.e., workflows." [Workflow. Wikipedia]
The example "Workflow diagram - Business" was drawn using the ConceptDraw PRO diagramming and vector drawing software extended with the Workflow Diagrams solution from the Business Processes area of ConceptDraw Solution Park.
Business - Work flow chart

Work Flow Chart

 Matrices
This solution extends ConceptDraw DIAGRAM software with samples, templates and library of design elements for drawing the business matrix diagrams.
Internal Audit Process

Workflow Diagram Symbols

 Workflow Diagrams
Workflow Diagrams solution extends ConceptDraw DIAGRAM software with samples, templates and vector stencils library for drawing the work process flowcharts.
Positioning Map

- Basic Flowchart Symbols and Meaning | Quality Control Chart ...
- Process Flowchart | Quality Control Chart Software — ISO ...
- Quality Control Flowchart Example
- Process Flowchart | Seven Basic Tools of Quality - Quality Control ...
- How To Make Flow Chart As Mechanical Engineer In Quality ...
- Flow Chart Of Quality Assurance
- Process Flowchart | Probability Quality Control Tools | Flow chart ...
- Quality Assurance Cycle
- Probability Quality Control Tools | Process Flowchart | TQM Diagram ...
- Process flowchart - QA processes in HSRU | Physics Diagrams ...
- Quality Assurance Process Flow Diagrams
- Quality Assurance Visio Business Flow Image
- Seven Basic Tools of Quality - Quality Control | Total Quality ...
- Give Wimple Flowchart Of Quality Assurance In Mechanical
- Quality Symbol In Control Plan
- Total Quality Management Value | Seven Basic Tools of Quality ...
- Process flowchart - QA processes in HSRU | Organic Chemistry ...
- Quality Flowchart
- Probability Quality Control Tools | Prioritization matrix - Health care ...
- Examples Of Flowchart For Quality Plan