Seven Basic Tools of Quality — Quality Control

Probability Quality Control Tools

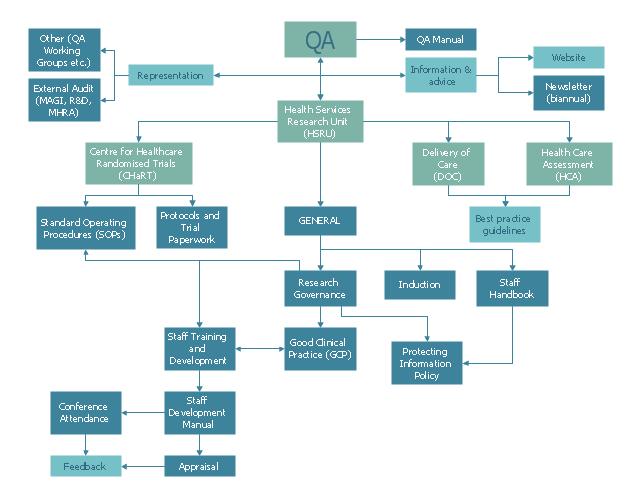
This example was created on the base of QA flowchart from the website of the Health Services Research Unit (HSRU), University of Aberdeen. [abdn.ac.uk/ hsru/ research/ quality/ qa-documents/ ]
"Quality assurance (QA) is a way of preventing mistakes or defects in manufactured products and avoiding problems when delivering solutions or services to customers...
QA is very important in the medical field because it helps to identify the standards of medical equipments and services. Hospitals and laboratories make use of external agencies in order to ensure standards for equipment such as X-ray machines, Diagnostic Radiology and AERB." [Quality assurance. Wikipedia]
The example "Process flowchart - QA processes in HSRU" was created using the ConceptDraw PRO software extended with the Seven Basic Tools of Quality solution from the Quality area of ConceptDraw Solution Park.
Flow chart example
Total Quality Management Value

 Seven Basic Tools of Quality
Manage quality control in the workplace, using fishbone diagrams, flowcharts, Pareto charts and histograms, provided by the Seven Basic Tools of Quality solution.
Workflow Diagram Symbols

Identifying Quality Management System

Process Flowchart


Value-Stream Mapping for Manufacturing
")
Fishbone Diagram Problem Solving

- TQM Diagram Example | Process Flowchart | Quality Control Chart ...
- Qa Flow Diagram
- Total Quality Management Definition | Process Flowchart | Block ...
- Process flowchart - QA processes in HSRU | Seven Basic Tools of ...
- Quality Assurance Visio Business Flow Image
- Tqm Flowchart Example
- Process Flowchart | Audit Flowcharts | Basic Audit Flowchart ...
- Examples Of Flowchart For Quality Plan
- Give Wimple Flowchart Of Quality Assurance In Mechanical