"Dimensions of service quality.
A customer's expectation of a particular service is determined by factors such as recommendations, personal needs and past experiences. The expected service and the perceived service sometimes may not be equal, thus leaving a gap. The service quality model or the ‘GAP model’ developed by a group of authors- Parasuraman, Zeithaml and Berry at Texas and North Carolina in 1985 , highlights the main requirements for delivering high service quality. It identifies five ‘gaps’ that cause unsuccessful delivery. Customers generally have a tendency to compare the service they 'experience' with the service they 'expect' . If the experience does not match the expectation , there arises a gap. Ten determinants that may influence the appearance of a gap were described by Parasuraman, Zeithaml and Berry. in the SERVQUAL model: reliability, responsiveness, competence, access, courtesy, communication, credibility, security, understanding the customer and tangibles.
Later, the determinants were reduced to five: tangibles; reliability; responsiveness; service assurance and empathy in the so called RATER model." [Service quality. Wikipedia]
The block diagram example "Gap model of service quality" was created using the ConceptDraw PRO diagramming and vector drawing software extended with the Block Diagrams solution from the area "What is a Diagram" of ConceptDraw Solution Park.
Block diagram

 Seven Basic Tools of Quality
Manage quality control in the workplace, using fishbone diagrams, flowcharts, Pareto charts and histograms, provided by the Seven Basic Tools of Quality solution.
 Workflow Diagrams
Workflow Diagrams solution extends ConceptDraw DIAGRAM software with samples, templates and vector stencils library for drawing the work process flowcharts.
Flowchart Software


Competitor Analysis

Business Tools Perceptual Mapping

 Matrices
This solution extends ConceptDraw DIAGRAM software with samples, templates and library of design elements for drawing the business matrix diagrams.
 Basic Floor Plans
Detailed floor plan is the basis of any building project, whether a home, office, business center, restaurant, shop store, or any other building or premise. Basic Floor Plans solution is a perfect tool to visualize your creative projects, architectural and floor plans ideas.
Examples Flowchart

ConceptDraw DIAGRAM diagramming and vector drawing software provides the unique Flowcharts Solution from the "Diagrams" Area of ConceptDraw Solution Park with variety of vector objects libraries and collection of examples Flowchart. Each example flowchart included in Flowcharts solution is a real help in drawing process, it can be the good base or perfect source of inspiration.
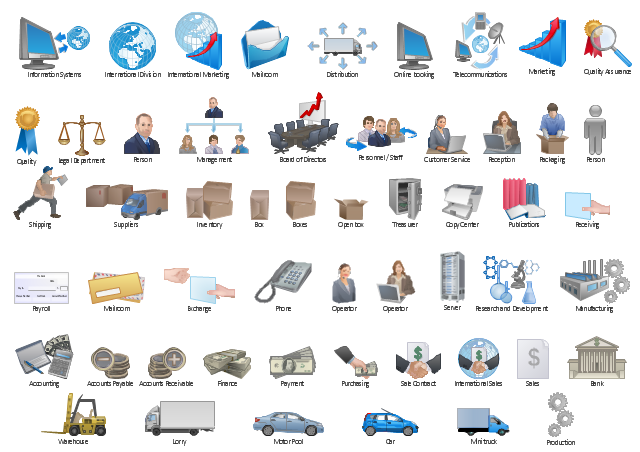
The vector stencils library "Workflow diagrams" contains 54 symbol icons for drawing the work flow charts.
Use these clipart to represent information flow, automation of business processes, business process re-engineering, accounting, management, and human resources tasks in industry, business, and manufacturing.
"A workflow consists of an orchestrated and repeatable pattern of business activity enabled by the systematic organization of resources into processes that transform materials, provide services, or process information. It can be depicted as a sequence of operations, declared as work of a person or group, an organization of staff, or one or more simple or complex mechanisms.
From a more abstract or higher-level perspective, workflow may be a view or representation of real work, thus serving as a virtual representation of actual work. The flow being described may refer to a document, service or product that is being transferred from one step to another.
Workflows may be viewed as one fundamental building block to be combined with other parts of an organisation's structure such as information silos, teams, projects, policies and hierarchies." [Workflow. Wikipedia]
The clipart example "Design elements - Workflow diagram" was drawn using the ConceptDraw PRO diagramming and vector drawing software extended with the Workflow Diagrams solution from the Business Processes area of ConceptDraw Solution Park.
Workflow symbols
SWOT Analysis

Swot Analysis Examples for Mac OSX

- Total Quality Management TQM Diagrams
- Block Diagram Of Quality Control
- Block Diagram Of Quality Assurance
- Block Diagram For Quality Control
- Block diagram - Gap model of service quality | Block Diagram ...
- Total Quality Management Value | Seven Basic Tools of Quality ...
- TQM Diagram Example | Process Flowchart | Probability Quality ...
- Quality Assurance Visio Business Flow Image
- Mind Map Quality Assurance Diagram
- Quality Assurance Process Flow Diagrams
- Seven Basic Tools of Quality - Quality Control | Workflow diagrams ...
- Basic Audit Flowchart. Flowchart Examples | Solving quadratic ...
- Block diagram - Gap model of service quality | Process Flowchart ...
- Seven Basic Tools of Quality - Quality Control | Process flowchart ...
- Diagram Block
- Seven Basic Tools of Quality - Quality Control | Total Quality ...
- Top 5 Android Flow Chart Apps | Functional Block Diagram | Basic ...
- Quality Assurance Cycle
- Qa Flow Diagram
- Give Wimple Flowchart Of Quality Assurance In Mechanical