Basic Audit Flowchart. Flowchart Examples

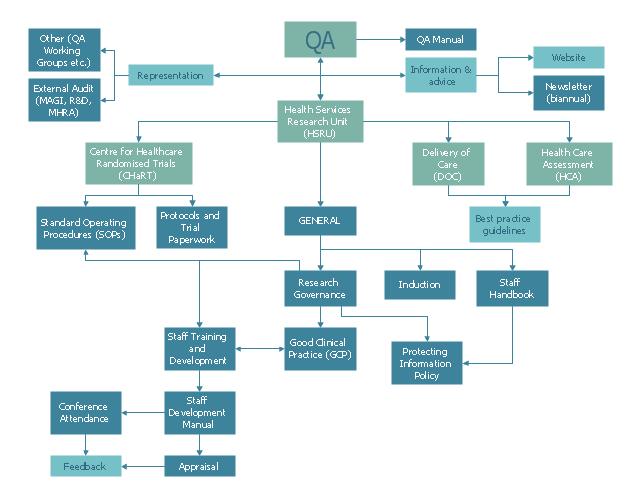
This example was created on the base of QA flowchart from the website of the Health Services Research Unit (HSRU), University of Aberdeen. [abdn.ac.uk/ hsru/ research/ quality/ qa-documents/ ]
"Quality assurance (QA) is a way of preventing mistakes or defects in manufactured products and avoiding problems when delivering solutions or services to customers...
QA is very important in the medical field because it helps to identify the standards of medical equipments and services. Hospitals and laboratories make use of external agencies in order to ensure standards for equipment such as X-ray machines, Diagnostic Radiology and AERB." [Quality assurance. Wikipedia]
The example "Process flowchart - QA processes in HSRU" was created using the ConceptDraw PRO software extended with the Seven Basic Tools of Quality solution from the Quality area of ConceptDraw Solution Park.
Flow chart example
Accounting Flowchart Symbols

Samples of Flowchart

Process Flow Diagram Symbols

"In elementary algebra, a quadratic equation (from the Latin quadratus for "square") is any equation having the form
ax^2+bx+c=0
where x represents an unknown, and a, b, and c are constants with a not equal to 0. If a = 0, then the equation is linear, not quadratic. The constants a, b, and c are called, respectively, the quadratic coefficient, the linear coefficient and the constant or free term.
Because the quadratic equation involves only one unknown, it is called "univariate". The quadratic equation only contains powers of x that are non-negative integers, and therefore it is a polynomial equation, and in particular it is a second degree polynomial equation since the greatest power is two.
Quadratic equations can be solved by a process known in American English as factoring and in other varieties of English as factorising, by completing the square, by using the quadratic formula, or by graphing." [Quadratic equation. Wikipedia]
The flowchart example "Solving quadratic equation algorithm" was created using the ConceptDraw PRO diagramming and vector drawing software extended with the Mathematics solution from the Science and Education area of ConceptDraw Solution Park.
Solving quadratic equation flow chart

Swim Lane Diagrams

Design Element: Active Directory for Network Diagrams


Electrical Symbols — Inductors

Venn Diagram

Pyramid Diagram

Circle Diagrams

2 Circle Venn Diagram. Venn Diagram Example

Scatter Chart Examples

Electrical Symbols — Rotating Equipment

Column Chart Examples

Scatter Graph

Electrical Symbols, Electrical Schematic Symbols

Venn Diagram Examples for Problem Solving. Environmental Social Science. Human Sustainability Confluence

Electrical Symbols, Electrical Diagram Symbols

- Euclidean algorithm - Flowchart | Solving quadratic equation ...
- Solving quadratic equation algorithm - Flowchart | C Program To ...
- Process Flowchart | Flowchart on Bank. Flowchart Examples | Data ...
- Block diagram - Automotive HVAC system | Process Flowchart ...
- Process Flow Diagram Symbols | Design elements - Heating ...
- Business Process Mapping | Market value - Pyramid diagram ...
- Electrical Symbols — Power Sources | Electrical Symbols ...
- Basic Network Diagram | Images On Ac Wiring Diagrams
- Ac Current Symbal
- Ac Current Symbal
- Process flowchart - QA processes in HSRU | Seven Basic Tools of ...
- Manufacturing and Maintenance | Energy resources diagram ...
- Process Flowchart | Best Program to Make Workflow Diagrams ...
- Medical Laboratory Process Flow Chart
- Block diagram - Automotive HVAC system | Process Flowchart ...
- | Block Diagram Of Computer System Using Graphics Program ...
- How to Create an Electrical Diagram Using ConceptDraw PRO | Ac ...
- HVAC Plans | Plant Layout Plans | Business diagrams & Org Charts ...
- Definition TQM Diagram | Total Quality Management Definition ...