Process Flowchart


Best Program to Make Workflow Diagrams

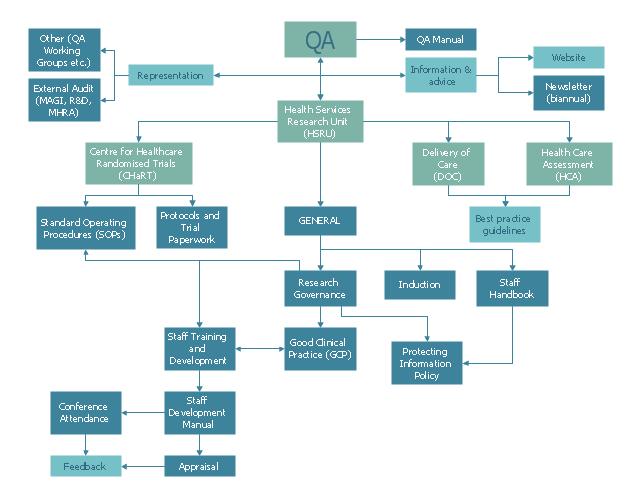
This example was created on the base of QA flowchart from the website of the Health Services Research Unit (HSRU), University of Aberdeen. [abdn.ac.uk/ hsru/ research/ quality/ qa-documents/ ]
"Quality assurance (QA) is a way of preventing mistakes or defects in manufactured products and avoiding problems when delivering solutions or services to customers...
QA is very important in the medical field because it helps to identify the standards of medical equipments and services. Hospitals and laboratories make use of external agencies in order to ensure standards for equipment such as X-ray machines, Diagnostic Radiology and AERB." [Quality assurance. Wikipedia]
The example "Process flowchart - QA processes in HSRU" was created using the ConceptDraw PRO software extended with the Seven Basic Tools of Quality solution from the Quality area of ConceptDraw Solution Park.
Flow chart example
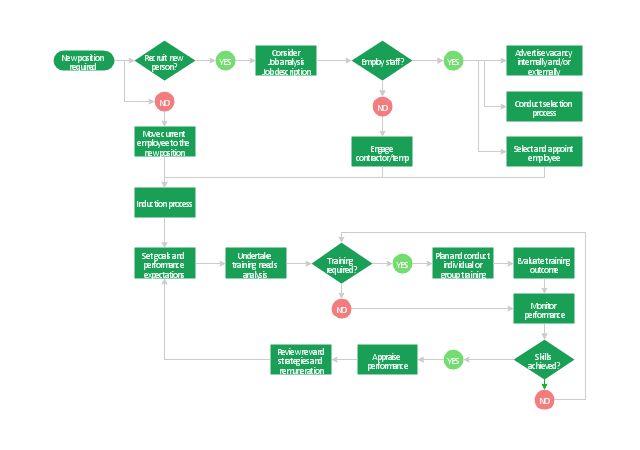
"Human resource management (HRM, or simply HR) is the management process of an organization's workforce, or human resources. It is responsible for the attraction, selection, training, assessment, and rewarding of employees, while also overseeing organizational leadership and culture and ensuring compliance with employment and labor laws. In circumstances where employees desire and are legally authorized to hold a collective bargaining agreement, HR will also serve as the company's primary liaison with the employees' representatives (usually a trades union).
HR is a product of the human relations movement of the early 20th century, when researchers began documenting ways of creating business value through the strategic management of the workforce. The function was initially dominated by transactional work, such as payroll and benefits administration, but due to globalization, company consolidation, technological advancement, and further research, HR now focuses on strategic initiatives like mergers and acquisitions, talent management, succession planning, industrial and labor relations, and diversity and inclusion." [Human resource management. Wikipedia]
The flow chart example "HR management process" was created using the ConceptDraw PRO diagramming and vector drawing software extended with the Flowcharts solution from the area "What is a Diagram" of ConceptDraw Solution Park.
Flowchart - HR management process
Flowchart Software

This flowchart example was created on the base of land sales process diagram from the Property management webpage of the VicRoads website.
[www.vicroads.vic.gov.au/ planning-and-projects/ property-services/ property-management]
"VicRoads or the Roads Corporation of Victoria is a statutory corporation which is the state road and traffic authority in the state of Victoria, Australia. It is responsible for maintenance and construction of the state arterial road network, as well as driver licensing and vehicle registration. VicRoads has broad responsibility for road safety policy and research. It is also responsible for regulating the accident towing industry in Victoria." [VicRoads. Wikipedia]
"Sales Process.
Once it has been established with the relevant VicRoads Regions/ Projects and other business areas that properties are identified as surplus to VicRoads’ operational needs, they are incorporated in the VicRoads annual sales program.
Following approval: relevant VicRoads Regional Manager and the VicRoads Chief Executive (and in some circumstances Minster for Public Transport and Roads) must approve all land deemed surplus and available for disposal.
The method of sale is then determined and consultant advice is sought:
(1) Planning.
(2) Valuer General Victoria (Valuer General’s office must provide a valuation for all sales).
(3) Government Land Monitor (Land Monitor approval is sought if the value exceeds $750,000).
(4) Environmental.
(5) Local Council." [www.vicroads.vic.gov.au/ planning-and-projects/ property-services/ property-management]
The example "Land sales process flowchart" was created using the ConceptDraw PRO diagramming and vector drawing software extended with the Sales Flowcharts solution from the Marketing area of ConceptDraw Solution Park.
Sales process chart

Diagram Flow Chart

Mind Maps for Business - SWOT Analysis

The Best Flowchart Software Available


How To Create a Workflow Diagram

This work flow chart sample was redesigned from the picture "Weather Forecast" from the article "Simulation Workflows".
[iaas.uni-stuttgart.de/ forschung/ projects/ simtech/ sim-workflows.php]
"(1) The weather is predicted for a particular geological area. Hence, the workflow is fed with a model of the geophysical environment of ground, air and water for a requested area.
(2) Over a specified period of time (e.g. 6 hours) several different variables are measured and observed. Ground stations, ships, airplanes, weather balloons, satellites and buoys measure the air pressure, air/ water temperature, wind velocity, air humidity, vertical temperature profiles, cloud velocity, rain fall, and more.
(3) This data needs to be collected from the different sources and stored for later access.
(4) The collected data is analyzed and transformed into a common format (e.g. Fahrenheit to Celsius scale). The normalized values are used to create the current state of the atmosphere.
(5) Then, a numerical weather forecast is made based on mathematical-physical models (e.g. GFS - Global Forecast System, UKMO - United Kingdom MOdel, GME - global model of Deutscher Wetterdienst). The environmental area needs to be discretized beforehand using grid cells. The physical parameters measured in Step 2 are exposed in 3D space as timely function. This leads to a system of partial differential equations reflecting the physical relations that is solved numerically.
(6) The results of the numerical models are complemented with a statistical interpretation (e.g. with MOS - Model-Output-Statistics). That means the forecast result of the numerical models is compared to statistical weather data. Known forecast failures are corrected.
(7) The numerical post-processing is done with DMO (Direct Model Output): the numerical results are interpolated for specific geological locations.
(8) Additionally, a statistical post-processing step removes failures of measuring devices (e.g. using KALMAN filters).
(9) The statistical interpretation and the numerical results are then observed and interpreted by meteorologists based on their subjective experiences.
(10) Finally, the weather forecast is visualized and presented to interested people." [iaas.uni-stuttgart.de/ forschung/ projects/ simtech/ sim-workflows.php]
The example "Workflow diagram - Weather forecast" was drawn using the ConceptDraw PRO diagramming and vector drawing software extended with the Workflow Diagrams solution from the Business Processes area of ConceptDraw Solution Park.
Work flow chart

Drawing Workflow Diagrams

SWOT Sample in Computers

- Process Flowchart | Using A Fully Labelled Flowchart Illustrate The ...
- Flow Chart Of Market Research Process In Sa
- Process Flowchart | Fully Labled Flowchart That Illustrates The ...
- Fully Labelled Flowchart Illustrate The Marketing Research Process
- Marketing Research Process Result In Flow Chart
- A Circle Diagram Of Research Process
- Process Flowchart | Best Program to Make Workflow Diagrams ...
- Process Flowchart | Best Program to Make Workflow Diagrams ...
- Process Flowchart | Online store social media response flowchart ...
- Process Flowchart | Best Program to Make Workflow Diagrams ...
- Process Flowchart | Workflow diagram - Weather forecast | How To ...
- Process Flowchart | Best Program to Make Diagrams | UML Diagram ...
- Process Flowchart | SWOT analysis matrix diagram templates ...
- Illustrate In A Circle Diagram The Research Process And Briefly
- Process Flowchart | Best Program to Make Workflow Diagrams ...
- Research cycle - Circle diagram | Innovation life cycle - Arrow loop ...
- How to Create a HR Process Flowchart Using ConceptDraw PRO ...
- Process Flowchart | Tool for Workgroup Briefings, Meetings and ...
- Process Flowchart | Land sales process flowchart | Basic ...