"Dimensions of service quality.
A customer's expectation of a particular service is determined by factors such as recommendations, personal needs and past experiences. The expected service and the perceived service sometimes may not be equal, thus leaving a gap. The service quality model or the ‘GAP model’ developed by a group of authors- Parasuraman, Zeithaml and Berry at Texas and North Carolina in 1985 , highlights the main requirements for delivering high service quality. It identifies five ‘gaps’ that cause unsuccessful delivery. Customers generally have a tendency to compare the service they 'experience' with the service they 'expect' . If the experience does not match the expectation , there arises a gap. Ten determinants that may influence the appearance of a gap were described by Parasuraman, Zeithaml and Berry. in the SERVQUAL model: reliability, responsiveness, competence, access, courtesy, communication, credibility, security, understanding the customer and tangibles.
Later, the determinants were reduced to five: tangibles; reliability; responsiveness; service assurance and empathy in the so called RATER model." [Service quality. Wikipedia]
The block diagram example "Gap model of service quality" was created using the ConceptDraw PRO diagramming and vector drawing software extended with the Block Diagrams solution from the area "What is a Diagram" of ConceptDraw Solution Park.
Block diagram

Block Diagram Creator

 Block Diagrams
Block diagrams solution extends ConceptDraw DIAGRAM software with templates, samples and libraries of vector stencils for drawing the block diagrams.
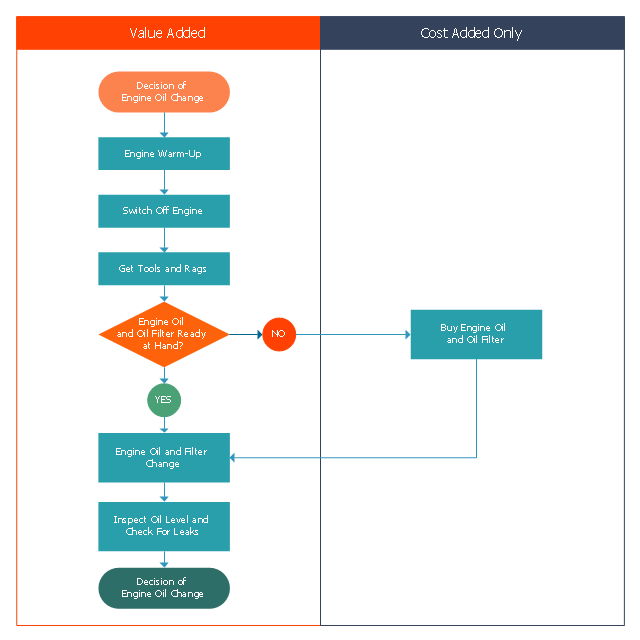
This opportunity flowchart sample shows the steps involved in replacing engine oil process. The opportunity flowcharts are used in business process improvement to identify process steps which might be improved.
"Business process improvement (BPI) is a systematic approach to help an organization optimize its underlying processes to achieve more efficient results. ...
An organization is only as good as its processes. To be able to make the necessary changes in an organization, one needs to understand the key processes of the company. Rummler and Brache suggested a model for running a Process Improvement and Management project (PI&M), containing the following steps:
1. Identify the process to be improved (based on a critical business issue): The identification of key processes can be a formal or informal exercise. The management team might select processes by applying a set of criteria derived from strategic and tactical priorities, or process selection is based on obvious performance gaps. It is important is to select the process(es) which have the greatest impact on a competitive advantage or customer requirement.
2. Develop the objective(s) for the project based on the requirements of the process: The focus might be on quality improvement, productivity, cost, customer service or cycle time. The goal is however always the same; to get the key process under control.
3. Select the members of the cross-functional team: A horizontal (cross-functional) analysis is carried out by a team composed of representatives of all functions involved in the process. While a consultant or in-house staff person can do the job, the quality of the analysis and the commitment to change is far greater with a cross-functional team.
4. Document the current process by creating a flowchart or "organization map": Describe the process regarding the Organizational level, the Process level and the Job/ Performer level according to Rummler. Develop a cross-functional process map for the process.
5. Identify "disconnects" in the process: “Disconnections” are everything that inhibit the efficiency and effectiveness of the process. The identification should be categorized into the three levels: The Organizational level, the Process level and the Job/ Performer level.
6. Recommend changes (organizational, in the process or in its execution): Categorize and prioritize the main problems and possibilities, evaluate alternative solutions. Develop a cross-functional process map for the recommended process.
7. Establish process and sub-process measures: The process measures should reflect the objectives of the project.
8. Implement the improvements." [Business process improvement. Wikipedia]
The swim lane diagram example "Opportunity flowchart - Replacing engine oil" was created using the ConceptDraw PRO diagramming and vector drawing software extended with the Cross-Functional Flowcharts solution from the Business Processes area of ConceptDraw Solution Park.
Swim lane diagram
 Quality Mind Map
This solution extends ConceptDraw MINDMAP software with Quality Management Mind Maps (Presentations, Meeting Agendas, Problem to be solved).
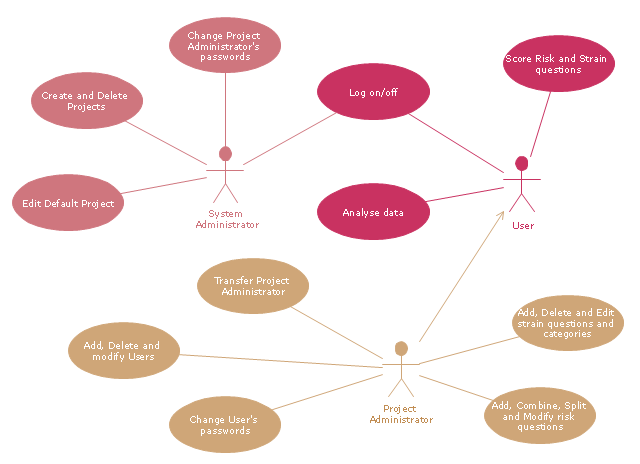
"A project manager is the person responsible for accomplishing the stated project objectives. Key project management responsibilities include creating clear and attainable project objectives, building the project requirements, and managing the constraints of the project management triangle, which are cost, time, scope, and quality.
A project manager is often a client representative and has to determine and implement the exact needs of the client, based on knowledge of the firm they are representing. A project manager is the bridging gap between the production team and client. So he/ she must have a fair knowledge of the industry they are in so that they are capable of understanding and discussing the problems with either party. The ability to adapt to the various internal procedures of the contracting party, and to form close links with the nominated representatives, is essential in ensuring that the key issues of cost, time, quality and above all, client satisfaction, can be realized.
The term and title 'project manager' has come to be used generically to describe anyone given responsibility to complete a project. However, it is more properly used to describe a person with full responsibility and the same level of authority required to complete a project. If a person does not have high levels of both responsibility and authority then they are better described as a project administrator, coordinator, facilitator or expeditor." [Project manager. Wikipedia]
The UML use case diagram example "Project administrator" was created using the ConceptDraw PRO diagramming and vector drawing software extended with the Rapid UML solution from the Software Development area of ConceptDraw Solution Park.
UML use case diagram
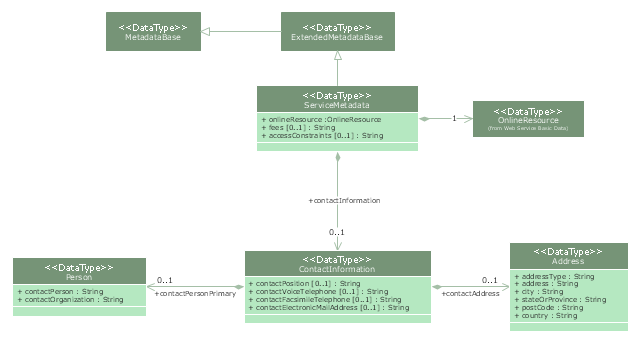
"Metadata is "data about data". The term is ambiguous, as it is used for two fundamentally different concepts (types). Structural metadata is about the design and specification of data structures and is more properly called "data about the containers of data"; descriptive metadata, on the other hand, is about individual instances of application data, the data content.
Metadata are traditionally found in the card catalogs of libraries. As information has become increasingly digital, metadata are also used to describe digital data using metadata standards specific to a particular discipline. By describing the contents and context of data files, the quality of the original data/ files is greatly increased. For example, a webpage may include metadata specifying what language it is written in, what tools were used to create it, and where to go for more on the subject, allowing browsers to automatically improve the experience of users." [Metadata. Wikipedia]
The UML class diagram example "Metadata information model" was created using the ConceptDraw PRO diagramming and vector drawing software extended with the Rapid UML solution from the Software Development area of ConceptDraw Solution Park.
UML class diagram
A five level pyramid model of different types of Information Systems based on the information processing requirement of different levels in the organization. The first level represents transaction processing systems to process basic data. The second level represents office support systems to process information in office. The third level represents management information systems to process information by managers. The fourth level represents decision support systems to process explicit knowledge. The fifth level represents executive information systems to process tacit knowledge.
"A Computer(-Based) Information System is essentially an IS using computer technology to carry out some or all of its planned tasks. The basic components of computer based information system are:
(1) Hardware - these are the devices like the monitor, processor, printer and keyboard, all of which work together to accept, process, show data and information.
(2) Software - are the programs that allow the hardware to process the data.
(3) Databases - are the gathering of associated files or tables containing related data.
(4) Networks - are a connecting system that allows diverse computers to distribute resources.
(5) Procedures - are the commands for combining the components above to process information and produce the preferred output.
The first four components (hardware, software, database and network) make up what is known as the information technology platform. Information technology workers could then use these components to create information systems that watch over safety measures, risk and the management of data. These actions are known as information technology services." [Information systems. Wikipedia]
This pyramid diagram was redesigned using the ConceptDraw PRO diagramming and vector drawing software from Wikimedia Commons file Five-Level-Pyramid-model.png. [commons.wikimedia.org/ wiki/ File:Five-Level-Pyramid-model.png]
This file is licensed under the Creative Commons Attribution 3.0 Unported license. [creativecommons.org/ licenses/ by/ 3.0/ deed.en]
The triangle chart example "Information systems types" is included in the Pyramid Diagrams solution from the Marketing area of ConceptDraw Solution Park.
Pyramid diagram

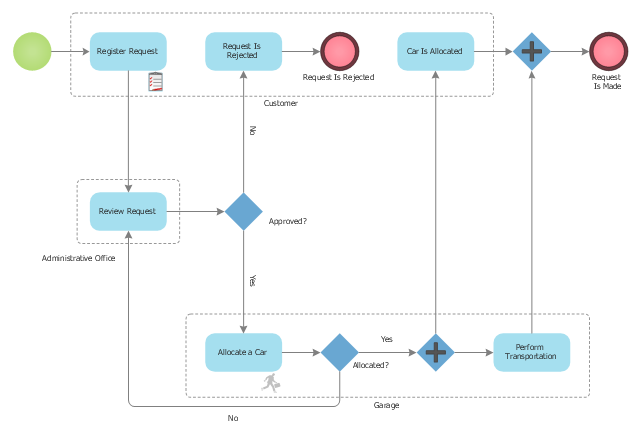
This BPMN (Business Process Model and Notation) diagram sample represents the taxi service order procedure workflow.
"A business process or business method is a collection of related, structured activities or tasks that produce a specific service or product (serve a particular goal) for a particular customer or customers. It often can be visualized with a flowchart as a sequence of activities with interleaving decision points or with a Process Matrix as a sequence of activities with relevance rules based on data in the process. ...
There are three types of business processes:
(1) Management processes, the processes that govern the operation of a system. Typical management processes include "corporate governance" and "strategic management".
(2) Operational processes, processes that constitute the core business and create the primary value stream. Typical operational processes are purchasing, manufacturing, advertising and marketing, and sales.
(3) Supporting processes, which support the core processes. Examples include accounting, recruitment, call center, technical support. ...
The ... improvement areas are equally applicable to policies, processes and detailed procedures (sub-processes/ tasks). There is a cascading effect of improvements made at a higher level on those made at a lower level.
For instance, if a recommendation to replace a given policy with a better one is made with proper justification and accepted in principle by business process owners, then corresponding changes in the consequent processes and procedures will follow naturally in order to enable implementation of the policies" [Business process. Wikipedia]
The business process modeling diagram example "Taxi service order procedure - BPMN 1.2 diagram" was created using the ConceptDraw PRO diagramming and vector drawing software extended with the Business Process Diagram solution from the Business Processes area of ConceptDraw Solution Park.
Business process modeling
8 Step Problem Solving

"Porter five forces analysis is a framework for industry analysis and business strategy development. It draws upon industrial organization (IO) economics to derive five forces that determine the competitive intensity and therefore attractiveness of a market. Attractiveness in this context refers to the overall industry profitability. An "unattractive" industry is one in which the combination of these five forces acts to drive down overall profitability. A very unattractive industry would be one approaching "pure competition", in which available profits for all firms are driven to normal profit.
Three of Porter's five forces refer to competition from external sources. The remainder are internal threats.
Porter referred to these forces as the micro environment, to contrast it with the more general term macro environment. They consist of those forces close to a company that affect its ability to serve its customers and make a profit. A change in any of the forces normally requires a business unit to re-assess the marketplace given the overall change in industry information. The overall industry attractiveness does not imply that every firm in the industry will return the same profitability. Firms are able to apply their core competencies, business model or network to achieve a profit above the industry average. A clear example of this is the airline industry. As an industry, profitability is low and yet individual companies, by applying unique business models, have been able to make a return in excess of the industry average.
Porter's five forces include - three forces from 'horizontal' competition: the threat of substitute products or services, the threat of established rivals, and the threat of new entrants; and two forces from 'vertical' competition: the bargaining power of suppliers and the bargaining power of customers.
This five forces analysis, is just one part of the complete Porter strategic models. The other elements are the value chain and the generic strategies." [Porter five forces analysis. Wikipedia]
The block diagram example "Porter's five forces model" was created using the ConceptDraw PRO diagramming and vector drawing software extended with the Block Diagrams solution from the area "What is a Diagram" of ConceptDraw Solution Park.
Block diagram

"In computer networking, cloud computing is computing that involves a large number of computers connected through a communication network such as the Internet, similar to utility computing. ...
Network-based services, which appear to be provided by real server hardware, and are in fact served up by virtual hardware, simulated by software running on one or more real machines are often called cloud computing. Such virtual servers do not physically exist and can therefore be moved around and scaled up or down on the fly without affecting the end user, somewhat like a cloud becoming larger or smaller without being a physical object. ...
Typically, the seller has actual energy-consuming servers which host products and services from a remote location, so end-users don't have to; they can simply log on to the network without installing anything. The major models of cloud computing service are known as software as a service, platform as a service, and infrastructure as a service. These cloud services may be offered in a public, private or hybrid network. Google, Amazon,leadsquared.com, Oracle Cloud, Salesforce, Zoho, Access2MyPC, and Microsoft Azure are some well-known cloud vendors." [Cloud computing. Wikipedia]
The AWS architecture diagram example "2-Tier Auto-scalable Web Application Architecture in 1 AZ" was created using the ConceptDraw PRO diagramming and vector drawing software extended with the AWS Architecture Diagrams solution from the Computer and Networks area of ConceptDraw Solution Park.
AWS architecture diagram
.png--diagram-flowchart-example.png)
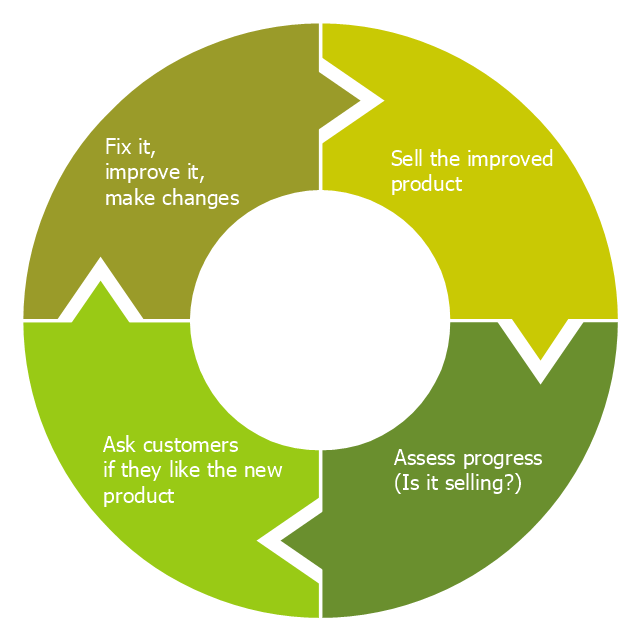
"Feedback is a process in which information about the past or the present influences the same phenomenon in the present or future. As part of a chain of cause-and-effect that forms a circuit or loop, the event is said to "feed back" into itself. ...
Feedback loop - the complete causal path that leads from the initial detection of the gap to the subsequent modification of the gap. ...
Feedback is commonly divided into two types - usually termed positive and negative. The terms can be applied in two contexts:
(1) the altering of the gap between reference and actual values of a parameter, based on whether the gap is widening (positive) or narrowing (negative),
(2) the valence of the action or effect that alters the gap, based on whether it has a happy (positive) or unhappy (negative) emotional connotation to the recipient or observer." [Feedback. Wikipedia]
This cycle diagram example was redesigned from the Wikimedia Commons file: Business Feedback Loop.jpg. [commons.wikimedia.org/ wiki/ File:Business_ Feedback_ Loop.jpg]
This file is made available under the Creative Commons CC0 1.0 Universal Public Domain Dedication. [creativecommons.org/ publicdomain/ zero/ 1.0/ deed.en]
The ring chart example "Business feedback loop" was created using the ConceptDraw PRO diagramming and vector drawing software extended with the Target and Circular Diagrams solution from the Marketing area of ConceptDraw Solution Park.
www.conceptdraw.com/ solution-park/ marketing-target-and-circular-diagrams
Ring chart
 SYSML
SYSML
The SysML solution helps to present diagrams using Systems Modeling Language; a perfect tool for system engineering.
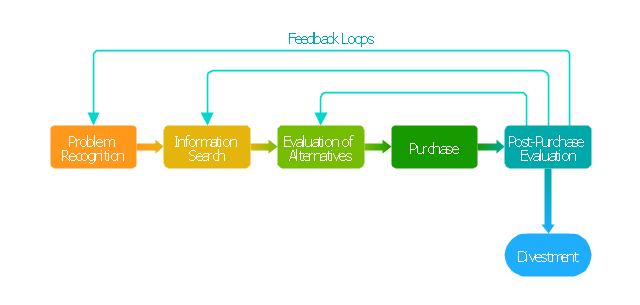
"Decision-making can be regarded as the cognitive process resulting in the selection of a belief and/ or a course of action among several alternative possibilities. Every decision-making process produces a final choice that may or may not prompt action. ...
Decision-making can also be regarded as a problem-solving activity terminated by a solution deemed to be satisfactory. It is, therefore, a reasoning or emotional process which can be rational or irrational and can be based on explicit assumptions or tacit assumptions. Most decisions are followed by some form of cost-benefit analysis. Rational choice theory encompasses the notion that people try to maximize benefits while minimizing costs.
Some have argued that most decisions are made unconsciously, if not involuntarily. Jim Nightingale, author of Think Smart – Act Smart, states that "we simply decide without thinking much about the decision process. ...
A major part of decision-making involves the analysis of a finite set of alternatives described in terms of evaluative criteria. Information overload occurs when there is a substantial gap between the capacity of information and the ways in which people may or can adapt."" [Decision-making. Wikipedia]
The block diagram example "Customer decision making" was created using the ConceptDraw PRO diagramming and vector drawing software extended with the Block Diagrams solution from the area "What is a Diagram" of ConceptDraw Solution Park.
Block diagram
BPMN 2.0

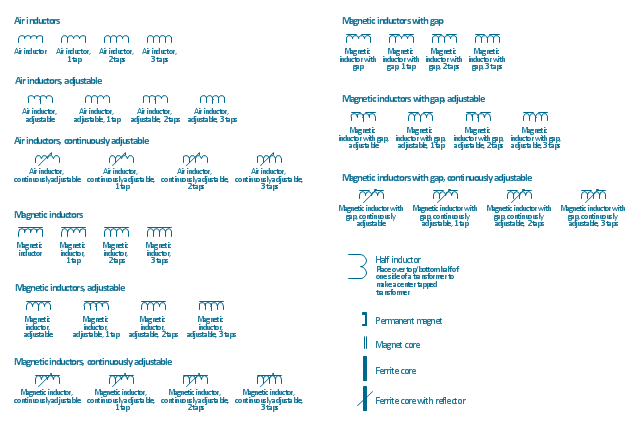
The vector stencils library "Inductors" contains 41 symbols of inductor elements for drawing electronic circuit diagrams.
"An inductor, also called a coil or reactor, is a passive two-terminal electrical component which resists changes in electric current passing through it. It consists of a conductor such as a wire, usually wound into a coil. When a current flows through it, energy is stored temporarily in a magnetic field in the coil. When the current flowing through an inductor changes, the time-varying magnetic field induces a voltage in the conductor, according to Faraday’s law of electromagnetic induction, which opposes the change in current that created it.
An inductor is characterized by its inductance, the ratio of the voltage to the rate of change of current, which has units of henries (H). Inductors have values that typically range from 1 µH (10-6H) to 1 H. Many inductors have a magnetic core made of iron or ferrite inside the coil, which serves to increase the magnetic field and thus the inductance. Along with capacitors and resistors, inductors are one of the three passive linear circuit elements that make up electric circuits. Inductors are widely used in alternating current (AC) electronic equipment, particularly in radio equipment. They are used to block the flow of AC current while allowing DC to pass; inductors designed for this purpose are called chokes. They are also used in electronic filters to separate signals of different frequencies, and in combination with capacitors to make tuned circuits, used to tune radio and TV receivers." [Inductor. Wikipedia]
The symbols example "Design elements - Inductors" was drawn using the ConceptDraw PRO diagramming and vector drawing software extended with the Electrical Engineering solution from the Engineering area of ConceptDraw Solution Park.
Inductor elements
 HR Flowcharts
Human resource management diagrams show recruitment models, the hiring process and human resource development of human resources.
A four level pyramid model of different types of Information Systems based on the different levels of hierarchy in an organization. The first level represents transaction processing systems for workers. The second level represents management information systems for middle managers. The third level represents decision support systems for senior menegers. The fourth level represents executive information systems for executives.
"The "classic" view of Information systems found in the textbooks in the 1980s was of a pyramid of systems that reflected the hierarchy of the organization, usually transaction processing systems at the bottom of the pyramid, followed by management information systems, decision support systems, and ending with executive information systems at the top. Although the pyramid model remains useful, since it was first formulated a number of new technologies have been developed and new categories of information systems have emerged, some of which no longer fit easily into the original pyramid model.
Some examples of such systems are:
data warehouses,
enterprise resource planning,
enterprise systems,
expert systems,
search engines,
geographic information system,
global information system,
office automation." [Information systems. Wikipedia]
This diagram was redesigned using the ConceptDraw PRO diagramming and vector drawing software from Wikimedia Commons file Four-Level-Pyramid-model.png. [commons.wikimedia.org/ wiki/ File:Four-Level-Pyramid-model.png]
This file is licensed under the Creative Commons Attribution-Share Alike 3.0 Unported license. [creativecommons.org/ licenses/ by-sa/ 3.0/ deed.en]
The triangle chart example "Information systems types" is included in the Pyramid Diagrams solution from the Marketing area of ConceptDraw Solution Park.
Pyramid diagram

"Brand essence is a phrase that communicates the fundamental nature of a trade name associated with one or more products made by the same company. A business marketing team will often spend considerable time developing effective ways of expressing the brand essence of their company's various brands by highlighting the unique benefits provided that pertain to the values of its target subculture." [businessdictionary.com/ definition/ brand-essence.html]
Brand essence model diagram visually display key points of brand essence in easy to understand form.
The example of wheel diagram (ring diagram, bevel style circle diagram) "Brand essence model" was created using the ConceptDraw PRO diagramming and vector drawing software extended with the Target and Circular Diagrams solution from the Marketing area of ConceptDraw Solution Park.
www.conceptdraw.com/ solution-park/ marketing-target-and-circular-diagrams
Wheel diagram

- Block diagram - Gap model of service quality | Draw The Servqual ...
- Block diagram - Gap model of service quality | Taxi Service Data ...
- Block diagram - Gap model of service quality | Service 4 Ss fishbone ...
- Block diagram - Gap model of service quality
- Block diagram - Gap model of service quality | Quality visualization ...
- Block diagram - Gap model of service quality | Service-goods ...
- Block diagram - Gap model of service quality | Diagrams Mean ...
- Block diagram - Automotive HVAC system | Block diagram - Gap ...
- Block diagram - Gap model of service quality | Model Based ...
- Block diagram - Gap model of service quality | Business Process ...
- Service -goods continuum diagram | Block diagram - Gap model of ...
- Quality management process model | Pyramid Diagram | Block ...
- Total Quality Management TQM Diagrams | Network Printer | Block ...
- Business Process Management | Process Flowchart | Business ...
- Fishbone Diagram | Fishbone Diagrams | Management | Fishbone ...
- Total Quality Management TQM Diagrams
- Address to User Story Question | Bank Customer Positive Feedback ...
- Block diagram - Sources of customer satisfaction | Block Diagram ...
- Quality management process model | Process Flowchart | Classic ...