This site uses cookies. By continuing to browse the ConceptDraw site you are agreeing to our Use of Site Cookies.

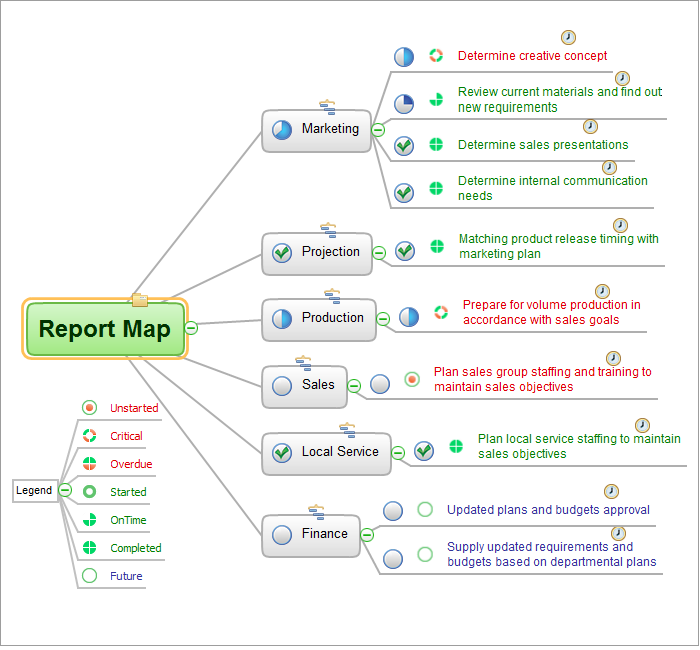
Project —Task Trees and Dependencies

Users new to ConceptDraw PROJECT will find the Basic lessons an essential platform for familiarizing themselves with the program′s functions. This video lesson will teach you how to set up task trees and dependencies.

ConceptDraw PROJECT Software Overview

ConceptDraw PROJECT is an effective tool for new and experienced users with a fine balance of usability and powerful functionality.

Software Work Flow Process in Project Management with Diagram

This sample was created in ConceptDraw DIAGRAM diagramming and vector drawing software using the Workflow Diagrams Solution from the Software Development area of ConceptDraw Solution Park.

This sample shows the Workflow Diagram that clearly illustrates stages a BPM consists of and relations between all parts of business. The Workflow Diagrams are used to represent the transferring of data during the work process, to study and analysis the working processes, and to optimize a workflow.

Software development with ConceptDraw products

Internet solutions on ConceptDraw base. What may interest developers of Internet solutions.

Critical Path Method in ConceptDraw PROJECT

The Critical Path Method (CPM) is an algorithm for scheduling a set of project activities. It is an important tool for effective project management. ConceptDraw PROJECT implements this method to provide the user with a wide set of project management tools.

How To Implement Collaborative Project Management

Collaborative Project Management via Skype is an ideal tool for project teams who need to master a growing project complexity.

How To Plan and Implement Projects Faster

ConceptDraw Office is the most effective tool for planning, tracking, and reporting all types of projects with strong management capabilities, user friendly functionality, and superior ease of use. In this tutorial video we will assist you in planning and managing a project using ConceptDraw Office.

Gantt Chart Software

The Gantt Chart is the main interface in ConceptDraw PROJECT. It summarizes the tasks in your project and presents them graphically so you can easily view your progress.

Pyramid Diagram

The Project Management Triangle Diagram depicts three main constraints of any project: scope, time and cost. Projects have to comply with the specified scope, projects should be finished in time and projects need to consume the budget. Each of the constraints represents one side of the triangle, and any change in budget or timing or scope affects the entire diagram.

One formula of professional mind mapping : input data + output data + make great presentation

Professional Mind Mapping. ConceptDraw MINDMAP professional software to create documents. Mac and PC compatible. MS Office Exchange Solutions. Skype Collaboration. Presentation Tools.

Pyramid Diagram

Those triangles within any technical analysis are known to be the chart patterns that can be commonly found in the price charts of the financially traded assets, such as stocks, futures, bonds, etc. The pattern is known to be deriving its name from the fact that it is characterized by some contraction in a price range being the converged trend lines, giving it a triangular shape.

Gantt charts for planning and scheduling projects

Using Gantt chart software is perfect for planning, scheduling and monitoring project development or resource allocation. ConceptDraw is simple project scheduling software for reporting project statuses and maintaining gantt charts of milestones and tasks.

How To Use Enterprise Collaboration Software

Enterprise collaboration software helps to facilitate action-oriented teams working together over geographic distances by providing tools that aids on communication, collaboration process and problem solving.

ConceptDraw DIAGRAM The best Business Drawing Software

ConceptDraw DIAGRAM is new software for business and technical drawing. Powerful business drawing tools, extensive libraries with pre-drawn shapes, free samples of business drawings, technical drawings and flowcharts, support of many graphic formats enable users to visually develop their business drawings charts and diagrams in any combination of drawings, diagrams and flow charts.

Business diagrams & Org Charts with ConceptDraw DIAGRAM

Business flowcharting tool helps you create a flowchart with minimal effort. With ConceptDraw you can make a flowchart, draw data flow diagrams, orgchart professional, process flow diagrams etc - without any prior knowledge or training.
Draw Business Process Diagrams

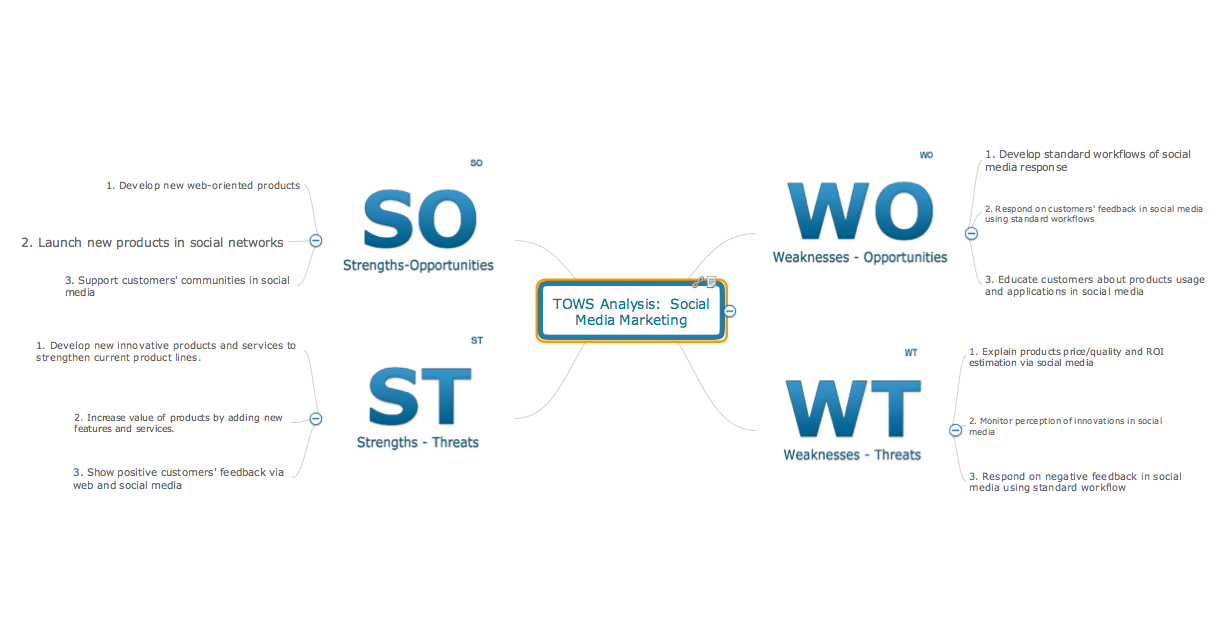
Software for Creating SWOT Analysis Diagrams

The ConceptDraw is a software for creating SWOT analysis diagrams. The SWOT Analysis solution includes the SWOT matrix samples, and templates that allow users create own SWOT and TOWS diagrams. Use the integration between the MINDMAP and DIAGRAM applications for fast drawing the SWOT matrix.

Simple & Fast Diagram Software

It is so simple making the drawing process easier and faster. you just need to choose the right drawing software.

ConceptDraw Arrows10 Technology - This is so easy and fast to draw any type of diagram with any degree of complexity.

Mind Map Making Software

The power, economy, and versatility of ConceptDraw MINDMAP takes personnel and team productivity to another level. Discover today what this means to you.