Project —Task Trees and Dependencies

UML Package Diagram. Design Elements

"A project network is a graph (flow chart) depicting the sequence in which a project's terminal elements are to be completed by showing terminal elements and their dependencies.
... the project network shows the "before-after" relations.
The most popular form of project network is activity on node, the other one is activity on arrow.
The condition for a valid project network is that it doesn't contain any circular references." [Project network. Wikipedia]
The PERT chart example "Project management plan" was created using the ConceptDraw PRO diagramming and vector drawing software extended with the solution "Seven Management and Planning Tools" from the Management area of ConceptDraw Solution Park.
PERT

Legend

Construction Project Chart Examples

Financial Trade UML Use Case Diagram Example

"Project planning is part of project management, which relates to the use of schedules such as Gantt charts to plan and subsequently report progress within the project environment.
Initially, the project scope is defined and the appropriate methods for completing the project are determined. Following this step, the durations for the various tasks necessary to complete the work are listed and grouped into a work breakdown structure. Project planning is often used to organize different areas of a project, including project plans, work loads and the management of teams and individuals. The logical dependencies between tasks are defined using an activity network diagram that enables identification of the critical path. Float or slack time in the schedule can be calculated using project management software. Then the necessary resources can be estimated and costs for each activity can be allocated to each resource, giving the total project cost. At this stage, the project schedule may be optimized to achieve the appropriate balance between resource usage and project duration to comply with the project objectives. Once established and agreed, the project schedule becomes what is known as the baseline schedule. Progress will be measured against the baseline schedule throughout the life of the project. Analyzing progress compared to the baseline schedule is known as earned value management.
The inputs of the project planning phase include the project charter and the concept proposal. The outputs of the project planning phase include the project requirements, the project schedule, and the project management plan." [Project planning. Wikipedia]
The flow chart example "Project planning process" was created using the ConceptDraw PRO diagramming and vector drawing software extended with the Flowcharts solution from the area "What is a Diagram" of ConceptDraw Solution Park.
Flowchart - Project planning process

Gantt Chart Templates

Program Evaluation and Review Technique (PERT) with ConceptDraw DIAGRAM
 with ConceptDraw DIAGRAM *")
ConceptDraw PROJECT Software Overview

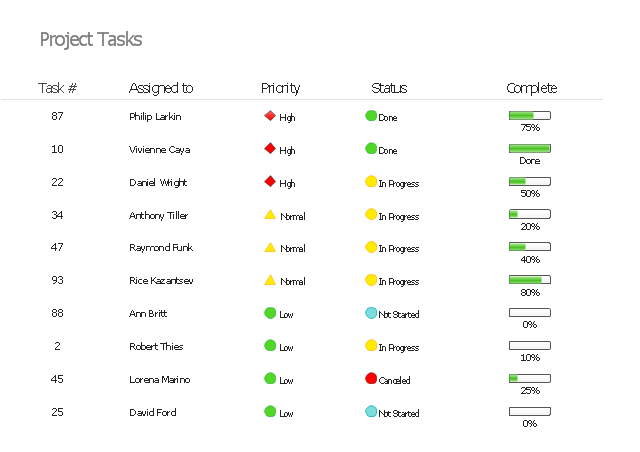
"In project management, a task is an activity that needs to be accomplished within a defined period of time or by a deadline. A task can be broken down into assignments which should also have a defined start and end date or a deadline for completion. One or more assignments on a task puts the task under execution. Completion of all assignments on a specific task normally renders the task completed. Tasks can be linked together to create dependencies." [Task (project management). Wikipedia]
The example "Project task status dashboard" was created using the ConceptDraw PRO diagramming and vector drawing software extended with the Status Dashboard solution from the area "What is a Dashboard" of ConceptDraw Solution Park.
The example "Project task status dashboard" was created using the ConceptDraw PRO diagramming and vector drawing software extended with the Status Dashboard solution from the area "What is a Dashboard" of ConceptDraw Solution Park.
Status dashboard
IDEF1 standard

Activity on Node Network Diagramming Tool

TQM Software — Build Professional TQM Diagrams

Communication Tool for Remote Project Management

Gantt chart examples

Basic of Flowchart: Meaning and Symbols


 SYSML
SYSML
In order to make a SysML-related drawing, the ConceptDraw DIAGRAM charting and drawing software can be used. Also, the SysML solution can be found as an extension to the ConceptDraw DIAGRAM application, enabling all those with systems engineering background to use the offered tools for creating the needed systems process models in order to use in the professional documentation for either distribution or analysis. Offering the vector stencil libraries full of the icons that may relate to each of the 9 official diagrams used in SysML, the SysML solution is useful for many system engineers.
Software and Database Design with ConceptDraw DIAGRAM

Entity-Relationship Diagram (ERD) with ConceptDraw DIAGRAM
 <br>with ConceptDraw DIAGRAM *")

- Project —Task Trees and Dependencies | ConceptDraw PROJECT ...
- Project —Task Trees and Dependencies | Software Project Tracking
- Project — Assigning Resources | What Is Project Planning Software
- Project —Task Trees and Dependencies | Quality Project ...
- Project —Task Trees and Dependencies | Cycle of automobile ...
- Project —Task Trees and Dependencies | How To Create Project ...
- Project —Task Trees and Dependencies | Project — Assigning ...
- Project —Task Trees and Dependencies | Software Work Flow ...
- Project —Task Trees and Dependencies | Product Overview | | Easy ...