Basic Diagramming


Scientific Symbols Chart

Mathematics Solution from the Science and Education area of ConceptDraw Solution Park includes a few shape libraries of plane, solid geometric figures, trigonometrical functions and greek letters to help you create different professional looking mathematic illustrations for science and education.
How can you illustrate the weather condition

Best Diagramming Software for macOS

Drawing Illustration

Chore charts with ConceptDraw DIAGRAM

CORRECTIVE ACTIONS PLANNING. Involvement Matrix


Classroom Seating Chart Maker

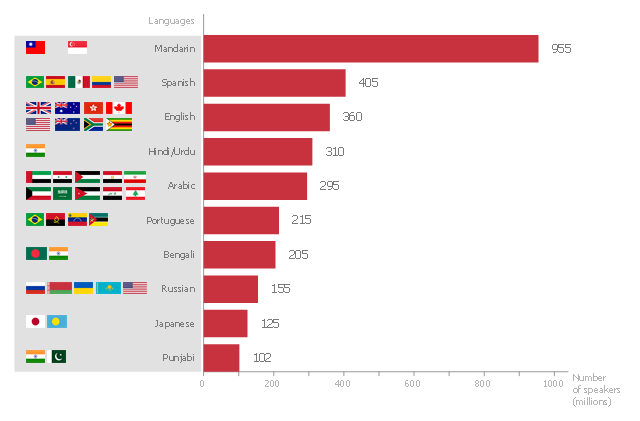
This bar graph sample shows the number of speakers for the most spoken languages of the world.
"In the philosophy of language, a natural language (or ordinary language) is any language which arises in an unpremeditated fashion as the result of the innate facility for language possessed by the human intellect. A natural language is typically used for communication, and may be spoken, signed, or written. Natural language is distinguished from constructed languages and formal languages such as computer-programming languages or the "languages" used in the study of formal logic, especially mathematical logic. ... Though the exact definition varies between scholars, natural language can broadly be defined in contrast on the one hand to artificial or constructed languages, computer programming languages like Python and international auxiliary languages like Esperanto, and on the other hand to other communication systems in nature, such as the waggle dance of bees. Although there are a variety of natural languages, any cognitively normal human infant is able to learn any natural language. By comparing the different natural languages, scholars hope to learn something about the nature of human intelligence and the innate biases and constraints that shape natural language, which are sometimes called universal grammar. The term "natural language" refers only a language that has developed naturally, and hence to actual speech, rather than prescribed speech. Hence, unstandardized speech (such as African American Vernacular English) is natural, whereas standardized speech such as Standard American English, which is in part prescribed, is somewhat artificial." [Natural language. Wikipedia]
The horizontal bar chart example "The most spoken languages of the world" was created using the ConceptDraw PRO diagramming and vector drawing software extended with the Bar Graphs solution from the Graphs and Charts area of ConceptDraw Solution Park.
Horizontal bar graph
Entity-Relationship Diagram (ERD) with ConceptDraw DIAGRAM


Fundraising Pyramid

 ConceptDraw Solution Park
ConceptDraw Solution Park collects graphic extensions, examples and learning materials
Cross Functional Flowchart Symbols

ConceptDraw DIAGRAM Compatibility with MS Visio

- Nature Scene To Draw In Chart
- How to Draw a Natural Landscape | Map Software | Map of ...
- Nature | Draw A Chart Of Hydrologic Circle
- Beautiful Nature Scene: Drawing | Draw Company Structure with ...
- Drawing a Nature Scene | Nature | Water Cycle In Nature Flow Chart
- Basic Diagramming | Chore charts with ConceptDraw PRO | Nature ...
- Water cycle diagram | Drawing Illustration | Drawing a Nature ...
- Drawing Illustration | Nature | ConceptDraw Solution Park | Water ...
- Nature Scene To Be Draw On Chart
- Pie Chart On Natural Park
- How to Draw a Natural Landscape | Drawing a Nature Scene ...
- Water cycle diagram | Drawing a Nature Scene | Drawing Illustration ...
- Beautiful Nature Scene: Drawing | Scientific Symbols Chart | Nature ...
- Nature Drawing Charts
- Basic Diagramming | Drawing a Nature Scene | Beauty in nature ...
- How to Draw a Natural Landscape | How to Draw an Effective ...
- Beautiful Nature Drawings Examples
- Water cycle diagram | Drawing a Nature Scene | Nature | Draw The ...
- Beautiful Nature Scene: Drawing | Basic Diagramming | Drawing ...