 ConceptDraw Solution Park
ConceptDraw Solution Park collects graphic extensions, examples and learning materials
How to Design a Good Workflow
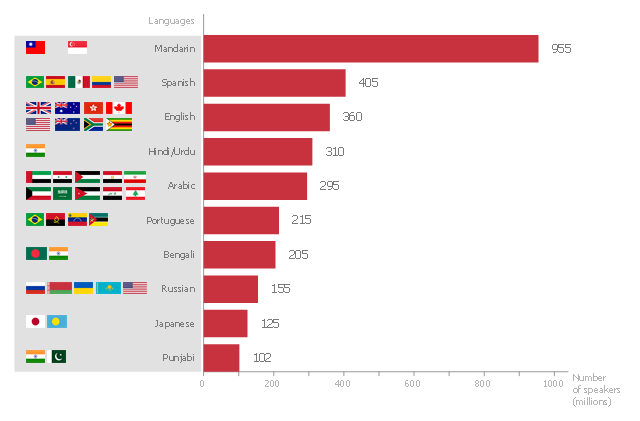
This bar graph sample shows the number of speakers for the most spoken languages of the world.
"In the philosophy of language, a natural language (or ordinary language) is any language which arises in an unpremeditated fashion as the result of the innate facility for language possessed by the human intellect. A natural language is typically used for communication, and may be spoken, signed, or written. Natural language is distinguished from constructed languages and formal languages such as computer-programming languages or the "languages" used in the study of formal logic, especially mathematical logic. ... Though the exact definition varies between scholars, natural language can broadly be defined in contrast on the one hand to artificial or constructed languages, computer programming languages like Python and international auxiliary languages like Esperanto, and on the other hand to other communication systems in nature, such as the waggle dance of bees. Although there are a variety of natural languages, any cognitively normal human infant is able to learn any natural language. By comparing the different natural languages, scholars hope to learn something about the nature of human intelligence and the innate biases and constraints that shape natural language, which are sometimes called universal grammar. The term "natural language" refers only a language that has developed naturally, and hence to actual speech, rather than prescribed speech. Hence, unstandardized speech (such as African American Vernacular English) is natural, whereas standardized speech such as Standard American English, which is in part prescribed, is somewhat artificial." [Natural language. Wikipedia]
The horizontal bar chart example "The most spoken languages of the world" was created using the ConceptDraw PRO diagramming and vector drawing software extended with the Bar Graphs solution from the Graphs and Charts area of ConceptDraw Solution Park.
Horizontal bar graph
 Audit Flowcharts
Audit flowcharts solution extends ConceptDraw DIAGRAM software with templates, samples and library of vector stencils for drawing the audit and fiscal flow charts.
 Area Charts
Area Charts are used to display the cumulative totals over time using numbers or percentages; or to show trends over time among related attributes. The Area Chart is effective when comparing two or more quantities. Each series of data is typically represented with a different color, the use of color transparency in an object’s transparency shows overlapped areas and smaller areas hidden behind larger areas.
 Cross-Functional Flowcharts
Cross-functional flowcharts are powerful and useful tool for visualizing and analyzing complex business processes which requires involvement of multiple people, teams or even departments. They let clearly represent a sequence of the process steps, the order of operations, relationships between processes and responsible functional units (such as departments or positions).
Pyramid Chart Examples

HelpDesk
How to Make a Garden Design

HelpDesk
How To Create an Involvement Matrix

 Nature
This solution extends ConceptDraw DIAGRAM software with samples, templates and libraries of vector clipart for drawing the Nature illustrations. Use it to make professional-looking documents, presentations and websites illustrated with color scalable vector c
HelpDesk
How to Manage Problem Solving Using Seven Management and Planning Tools


 Accounting Flowcharts
Accounting Flowcharts solution extends ConceptDraw DIAGRAM software with templates, samples and library of vector stencils for drawing the accounting flow charts.
 Bar Graphs
The Bar Graphs solution enhances ConceptDraw DIAGRAM functionality with templates, numerous professional-looking samples, and a library of vector stencils for drawing different types of Bar Graphs, such as Simple Bar Graph, Double Bar Graph, Divided Bar Graph, Horizontal Bar Graph, Vertical Bar Graph, and Column Bar Chart.
 Pie Charts
Pie Charts are extensively used in statistics and business for explaining data and work results, in mass media for comparison (i.e. to visualize the percentage for the parts of one total), and in many other fields. The Pie Charts solution for ConceptDraw DIAGRAM offers powerful drawing tools, varied templates, samples, and a library of vector stencils for simple construction and design of Pie Charts, Donut Chart, and Pie Graph Worksheets.
Bar Diagram Math

- Beautiful Nature Scene: Drawing | Scientific Symbols Chart | Clipart ...
- How to Draw a Natural Landscape | How to Draw an Effective ...
- Beautiful Nature Scene: Drawing | Nature Drawings - How to Draw ...
- Basic Diagramming | Drawing a Nature Scene | Beauty in nature ...
- Beautiful Nature Drawings Examples
- Artwork | Clipart School | Nature | Animals Pictures
- Program to Make Flow Chart | Good Flow Chart app for Mac ...
- Beauty of Event-driven Process Chain (EPC) diagrams | Beautiful ...
- Drawing a Nature Scene | Nature | Water Cycle In Nature Flow Chart
- Cross-Functional Flowcharts | Accounting Flowcharts | Social Media ...
- Drawing a Nature Scene | Beautiful Nature Scene: Drawing ...
- How to Draw a Natural Landscape | Nature Drawings - How to Draw ...
- Universal Diagramming Area | Maps | How to Draw a Natural ...
- Water cycle diagram | Drawing a Nature Scene | Drawing Illustration ...
- Beautiful Nature Scene: Drawing | Astronomy Pictures | Nature ...
- Nature | ConceptDraw Solution Park | Cross-Functional Flowcharts ...
- Program to Make Flow Chart | Drawing Illustration | BPR Diagram ...
- Nature | ConceptDraw Solution Park | Water Cycle Chain Chart
- Chart For Nature
- Pie Chart On Natural Park