Data Flow Diagram Examples

Sales Process Flowchart Symbols

Accounts Payable Process Flow Chart

Design Data Flow. DFD Library

Flow Diagrams

Sales Process Steps

Presenting Documents with Remote Presentation for Skype Solution

Technical Flow Chart

Sales Process

Business Processes description with ConceptDraw DIAGRAM

IDEF0 Flowchart Symbols

The Best Tool for Business Process Modeling

What is DFD Diagram?DFD Diagram Creator

Cisco Products Additional. Cisco icons, shapes, stencils and symbols

Example Basic Flowchart. Flowchart Examples

Flow Chart Online

The Best Business Process Modeling Software: Comprehensive Guide


Process Flow Diagram

The vector stencils library "Cisco network topology" contains 89 symbols of Cisco network devices and design elements for drawing computer network topology diagrams.
"There are two basic categories of network topologies:
(1) Physical topologies,
(2) Logical topologies.
The shape of the cabling layout used to link devices is called the physical topology of the network. This refers to the layout of cabling, the locations of nodes, and the interconnections between the nodes and the cabling. The physical topology of a network is determined by the capabilities of the network access devices and media, the level of control or fault tolerance desired, and the cost associated with cabling or telecommunications circuits.
The logical topology in contrast, is the way that the signals act on the network media, or the way that the data passes through the network from one device to the next without regard to the physical interconnection of the devices." [Network topology. Wikipedia]
The symbols example "Cisco network topology - Vector stencils library" was created using the ConceptDraw PRO diagramming and vector drawing software extended with the Cisco Network Diagrams solution from the Computer and Networks area of ConceptDraw Solution Park.
www.conceptdraw.com/ solution-park/ computer-networks-cisco
Router
Broadband router

Router firewall

Wireless router

Workgroup switch
ATM switch
ISDN switch
Multilayer switch
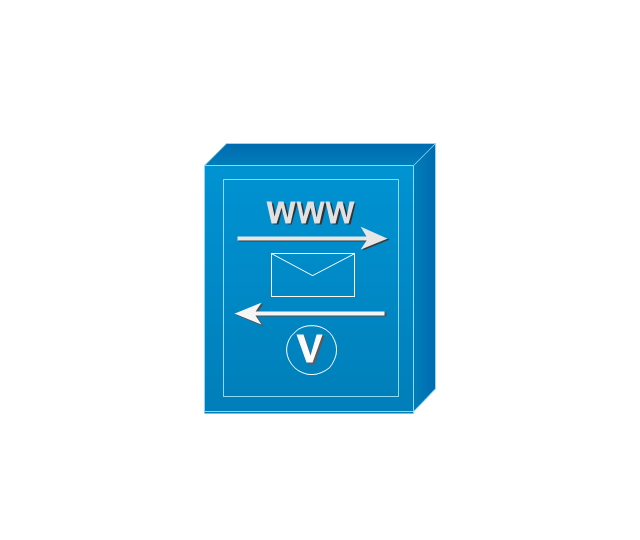
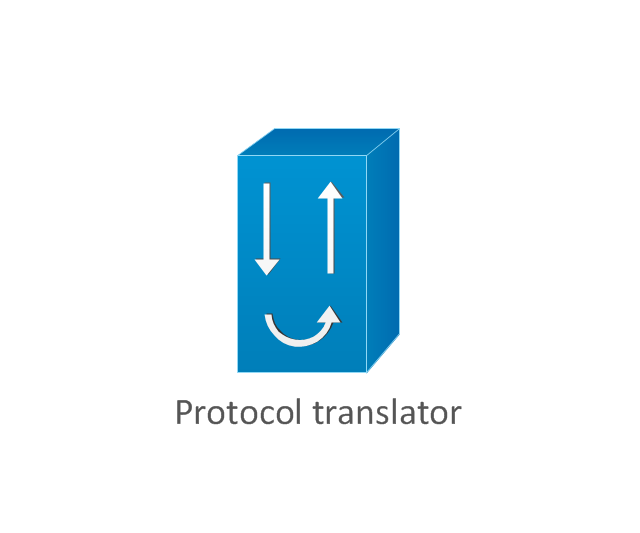
Protocol translator
Communications server

Transpath
Bridge
Terminal server
Route switch processor
Content engine (cache director)
-cisco-network-topology---vector-stencils-library.png--diagram-flowchart-example.png)
Management engine (ME 1100)
-cisco-network-topology---vector-stencils-library.png--diagram-flowchart-example.png)
Switch processor
ITP
Voice gateway
BBSM
ATA
SIP Proxy server
NetRanger
Cisco 1000
IP
System controller
ACE

Directory server

ADM
Cisco Unity Express
Unity server
Cisco security
CallManager
DSLAM
H.323
CDM (Content Distribution Manager)
-cisco-network-topology---vector-stencils-library.png--diagram-flowchart-example.png)
ICM
Access point
Wireless bridge
Wireless connectivity

Guard
Mobile access router
Carrier Routing System (CRS)
-cisco-network-topology---vector-stencils-library.png--diagram-flowchart-example.png)
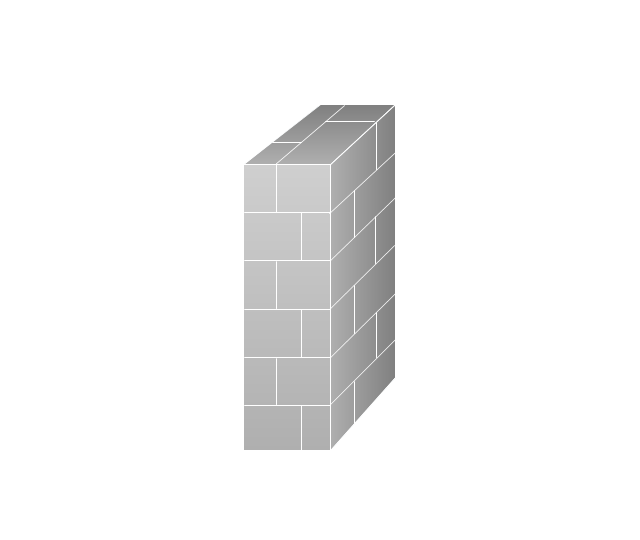
Vault
Workstation
PC
Macintosh
Cloud, gold
Cloud, white
Cloud, standard color

Cisco security management
PBX
DPT
Government building

Headquarters, blue
Router in building
Man
Woman
Workgroup switch, subdued
Router, subdued
File server
Firewall, horizontal

Firewall, vertical

Firewall, vertical, subdued
Lock

Key

Lock and key

Car
Truck
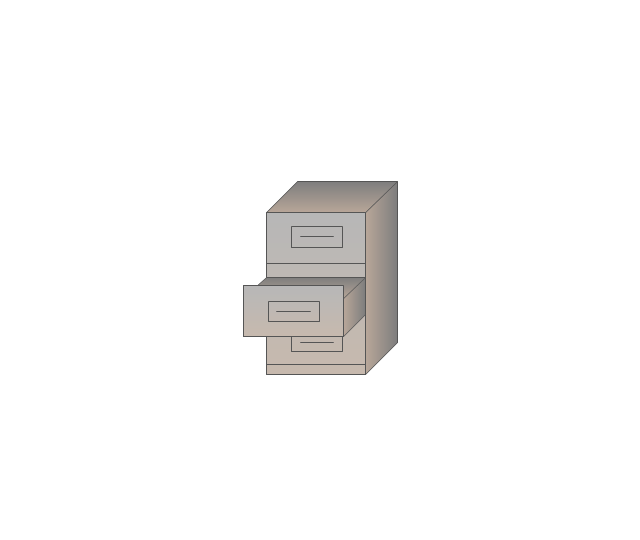
File cabinet
Breakout box
Breakout box, blue
Host

Relational database
Modem
BBS (Bulletin Board System)
-cisco-network-topology---vector-stencils-library.png--diagram-flowchart-example.png)
Satellite
Satellite dish
UPS

RPS

MAU
PAD

PAD X.28

Diskette
Contact center
Page icon
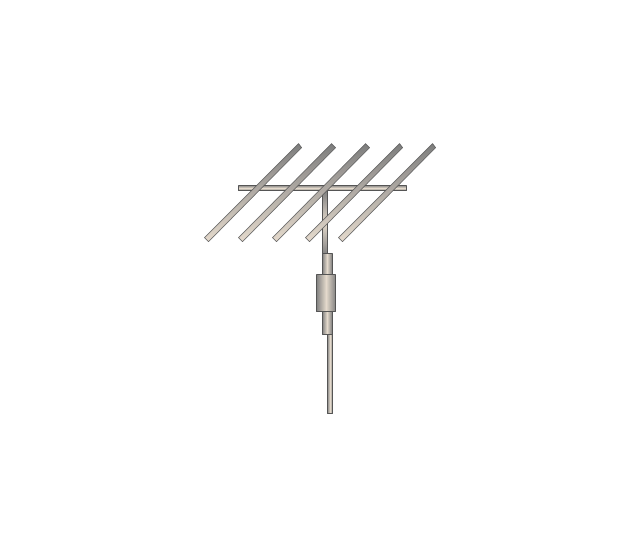
Antenna
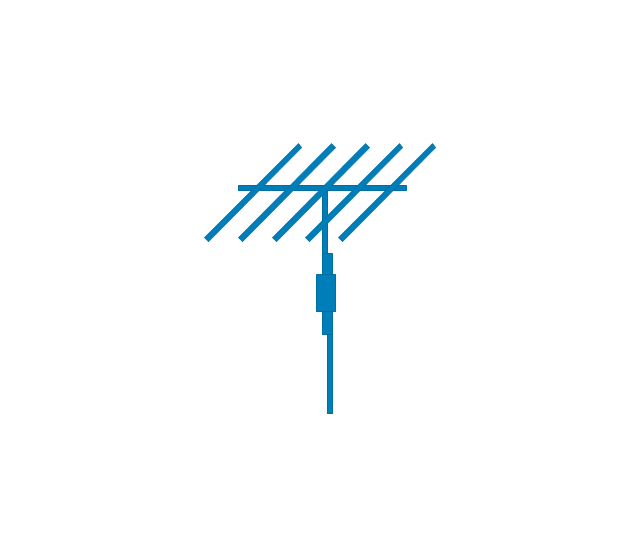
Antenna, blue
Radio tower

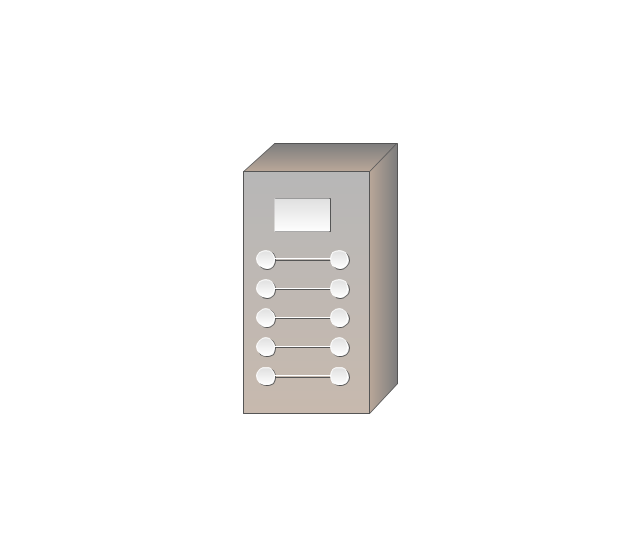
The vector stencils library "Cisco products additional" contains 141 symbols of computer network devices and equipment for drawing Cisco network diagrams.
The symbols example "Cisco products additional - Vector stencils library" was created using the ConceptDraw PRO diagramming and vector drawing software extended with the Cisco Network Diagrams solution from the Computer and Networks area of ConceptDraw Solution Park.
www.conceptdraw.com/ solution-park/ computer-networks-cisco
Protocol translator
CiscoWorks workstation
Access server
Workgroup director
Network management appliance
Storage Solution Engine (SSE)
-cisco-products-additional---vector-stencils-library.png--diagram-flowchart-example.png)
Software based router on file / application server
Cisco MeetingPlace Express
PC router card
Transpath
Bridge
IOS SLB
100BaseT hub
uBR910
CDDI-FDDI
PC adapter card
VIP
CSM-S
Terminal server
Route/Switch processor with Si
Route/Switch processor
PXF
AVS (Application Velicity System)
-cisco-products-additional---vector-stencils-library.png--diagram-flowchart-example.png)
Content engine (cache director)
-cisco-products-additional---vector-stencils-library.png--diagram-flowchart-example.png)
Cisco file engine
Management engine (ME 1100)
-cisco-products-additional---vector-stencils-library.png--diagram-flowchart-example.png)
PC with router-based software
PC with software
ASIC processor
Generic processor
Switch processor
Cisco 5500 family
Multi-switch device
IP transport concentrator
ITP
Cisco CA
Voice gateway
BBSM
ATA
SIP Proxy server
MicroWeb server

NetRanger
Cisco 6920 RateMux
NetSonar
Cisco 1000
IP
System controller
ACE
Voice-enabled access server (voice-enabled communications server)
-cisco-products-additional---vector-stencils-library.png--diagram-flowchart-example.png)
Directory server

Cisco 4310 end office system
ADM
FireWall Service Module (FWSM)
-cisco-products-additional---vector-stencils-library.png--diagram-flowchart-example.png)
Cisco Unity Express
Cisco Unity Server
Centri firewall
Cisco Security Manager
Data switch processor (AKA data center switch)
-cisco-products-additional---vector-stencils-library.png--diagram-flowchart-example.png)
Cisco MP
IOS firewall
PIX firewall, right
PIX firewall, left
CallManager
Cisco 6700 Series
MGX 8240
MGX 8220
MGX 8260
DSLAM
Cisco 6732 access server
Cisco 6701
H.323
Access gateway
ICS 7750
VPN concentrator
SSL terminator
CDM (Content Distribution Manager)
-cisco-products-additional---vector-stencils-library.png--diagram-flowchart-example.png)
Cisco 15200
Cisco 15800
Content Service Module
Content Transformation Engine (CTE)
-cisco-products-additional---vector-stencils-library.png--diagram-flowchart-example.png)
Cisco VN 2900
Cisco VN 5900
Cisco VN 5902
Cisco Unified Presence Server
ICM
PC card
Access point
Dual mode access point
EtherClient

Tablet
Wireless transport
Wireless bridge
Lightweight single radio access point
Lightweight Double Radio Access Point
WLAN controller
Wi-Fi tag
Wireless location appliance
Wireless connectivity

WiSM
Mesh AP
SC2200 Signaling Controller
Virtual Switch Controller (VSC3000)
-cisco-products-additional---vector-stencils-library.png--diagram-flowchart-example.png)
VS C3000 or SC2200 host
BTS 10200 Softswitch
Detector
IP/TV content manager
IP/TV broadcast server
Universal gateway

Generic softswitch
Generic Softswitch (blue)
-cisco-products-additional---vector-stencils-library.png--diagram-flowchart-example.png)
Guard
Mobile access router
Carrier Routing System (CRS)
-cisco-products-additional---vector-stencils-library.png--diagram-flowchart-example.png)
FC storage
Intelliswitch Stack
Service control
UPC (Unified Personal Communicator)
-cisco-products-additional---vector-stencils-library.png--diagram-flowchart-example.png)
PMC
IP communicator

Streamer
Vault
DWDM filter
DWDM ring
DWDM network line
Streamer (half-full)
-cisco-products-additional---vector-stencils-library.png--diagram-flowchart-example.png)
Vault (half-full)
-cisco-products-additional---vector-stencils-library.png--diagram-flowchart-example.png)
Data center switch, reversed
Scanner
10GE/FCoE
car
CUBE
Director-class fibre channel director
Fibre channel disk subsystem
Fibre channel fabric switch
Generic gateway
Handheld
Internet streamer
JBOD

MAS gateway
Mesh AP
Mobile streamer
- Accounting Information Systems Flowchart Symbols | What Are The ...
- Transformation Flow Chart
- Database Flowchart Symbols | ERD Symbols and Meanings | Data ...
- Basic Flowchart Symbols and Meaning | Technical Flow Chart ...
- Process Flow Diagram Symbols | Flow Chart Symbols | Design ...
- How to Create a Data Flow Diagram using ConceptDraw PRO | Data ...
- Data Flow Diagram Examples | Flow Chart Symbols | Flow Chart ...
- How to Simplify Flow Charting — Cross-functional Flowchart | In ...
- Data Flow Diagram Symbols . DFD Library | Yourdon and Coad ...
- Cisco Products Additional. Cisco icons, shapes, stencils and ...