HelpDesk
How to Track Your Project Plan vs. the Actual Project Condition
ConceptDraw PROJECT allows following how the project is going. You can easily compare the actual project data with the planned ones. The best tool for effective tracking of the project execution is to compare real data with the project baseline. It consists of the baseline start, baseline finish and baseline cost. Along with Baseline tracking ConceptDraw PROJECT offers several types of visual reports that can help to assess visually the difference between planned and actual project data.Project — Working With Costs
ConceptDraw PROJECT delivers a rich set of built-in functionalities and optional product extensions that support your daily workflow in time-saving and creative ways. This video lesson will teach you how to work with costs in your project document.What Constitutes a Project?
Separated into categories of Basic, Intermediate, and Advanced categories, the new instructional videos about ConceptDraw PROJECT cover a huge breadth of topics. Users new to ConceptDraw PROJECT will find the Basic lessons an essential platform for familiarizing themselves with the programs′s functions. This video lesson is the first in Basic lessons series.How To Plan and Implement Projects Faster
ConceptDraw Office is the most effective tool for planning, tracking, and reporting all types of projects with strong management capabilities, user friendly functionality, and superior ease of use. In this tutorial video we will assist you in planning and managing a project using ConceptDraw Office.Product Overview
ConceptDraw PROJECT is a vigorous tool for managing single or multiple projects. It lets you determine all essential elements involved into project, control schedules, resources and finances, and monitor projects' progress in most effective yet simple manner.Business Graphics Software
ConceptDraw DIAGRAM is a business graphics software that allows you improve your business using Sales Performance Dashboard helps you analyze your data more efficiently.Competitor Analysis
Competitor analysis is a first and obligatory step in elaboration the proper corporate marketing strategy and creating sustainable competitive advantage. Use powerful opportunities of numerous solutions from ConceptDraw Solution Park for designing illustrative diagrams, charts, matrices which are necessary for effective competitor analysis.
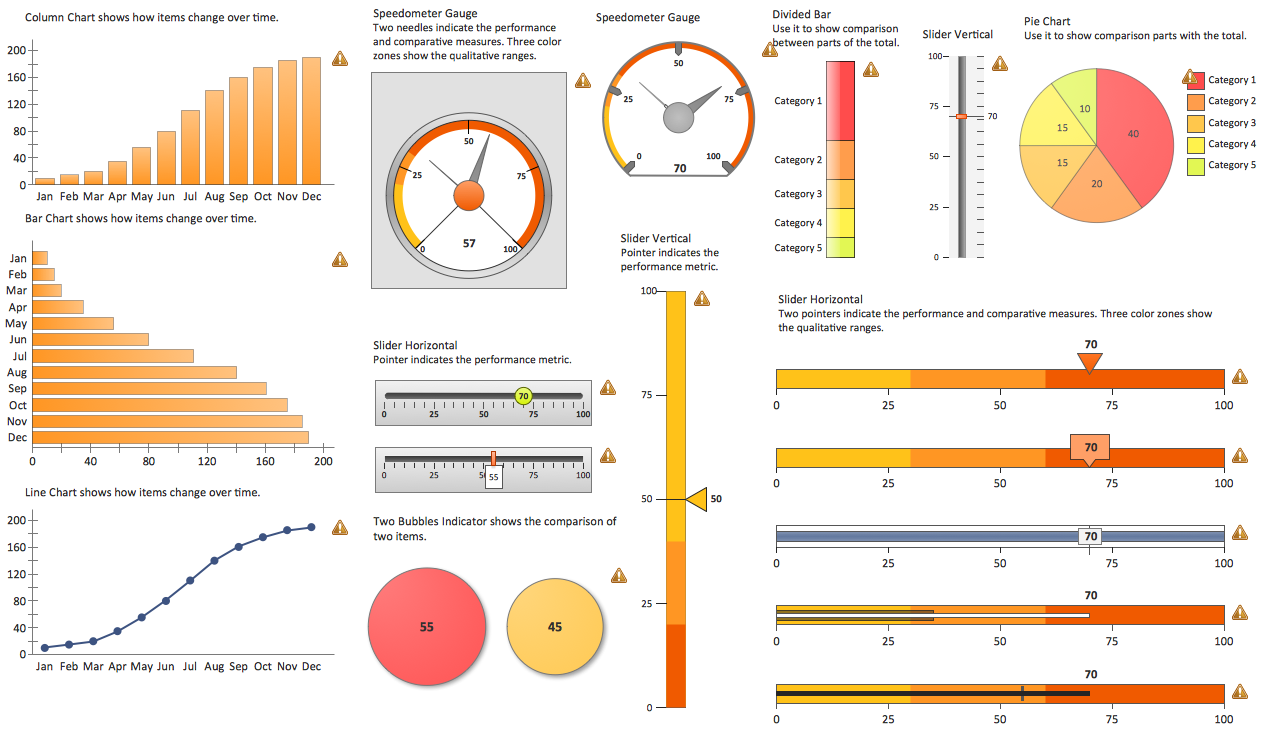
Reporting & Data Visualization
Using professional reporting and data visualization is the way your business can improve. ConceptDraw Sales Dashboard solution allows you produce live dashboards show KPI to monitor you sales activity and results in real time.PERT Chart Software
PERT Chart Software - Activity Network and Project Evaluation and Review Technique, or PERT, charts are a way of documenting and analyzing the tasks in a project.ConceptDraw DIAGRAM is a powerful diagramming and vector drawing software for designing professional looking PERT Charts quick and easy.
Purchasing Flow Chart. Purchasing Flowchart Example
This sample shows the Purchasing Flow Chart Diagram that displays the money flow in the carbon offset sphere. The carbon offsets are the compensatory measures that the companies make for the carbon emissions. You can see on this sample the groups that have interests in the carbon offsets and the money flow after the carbon offset vendors sold the carbon offsets.
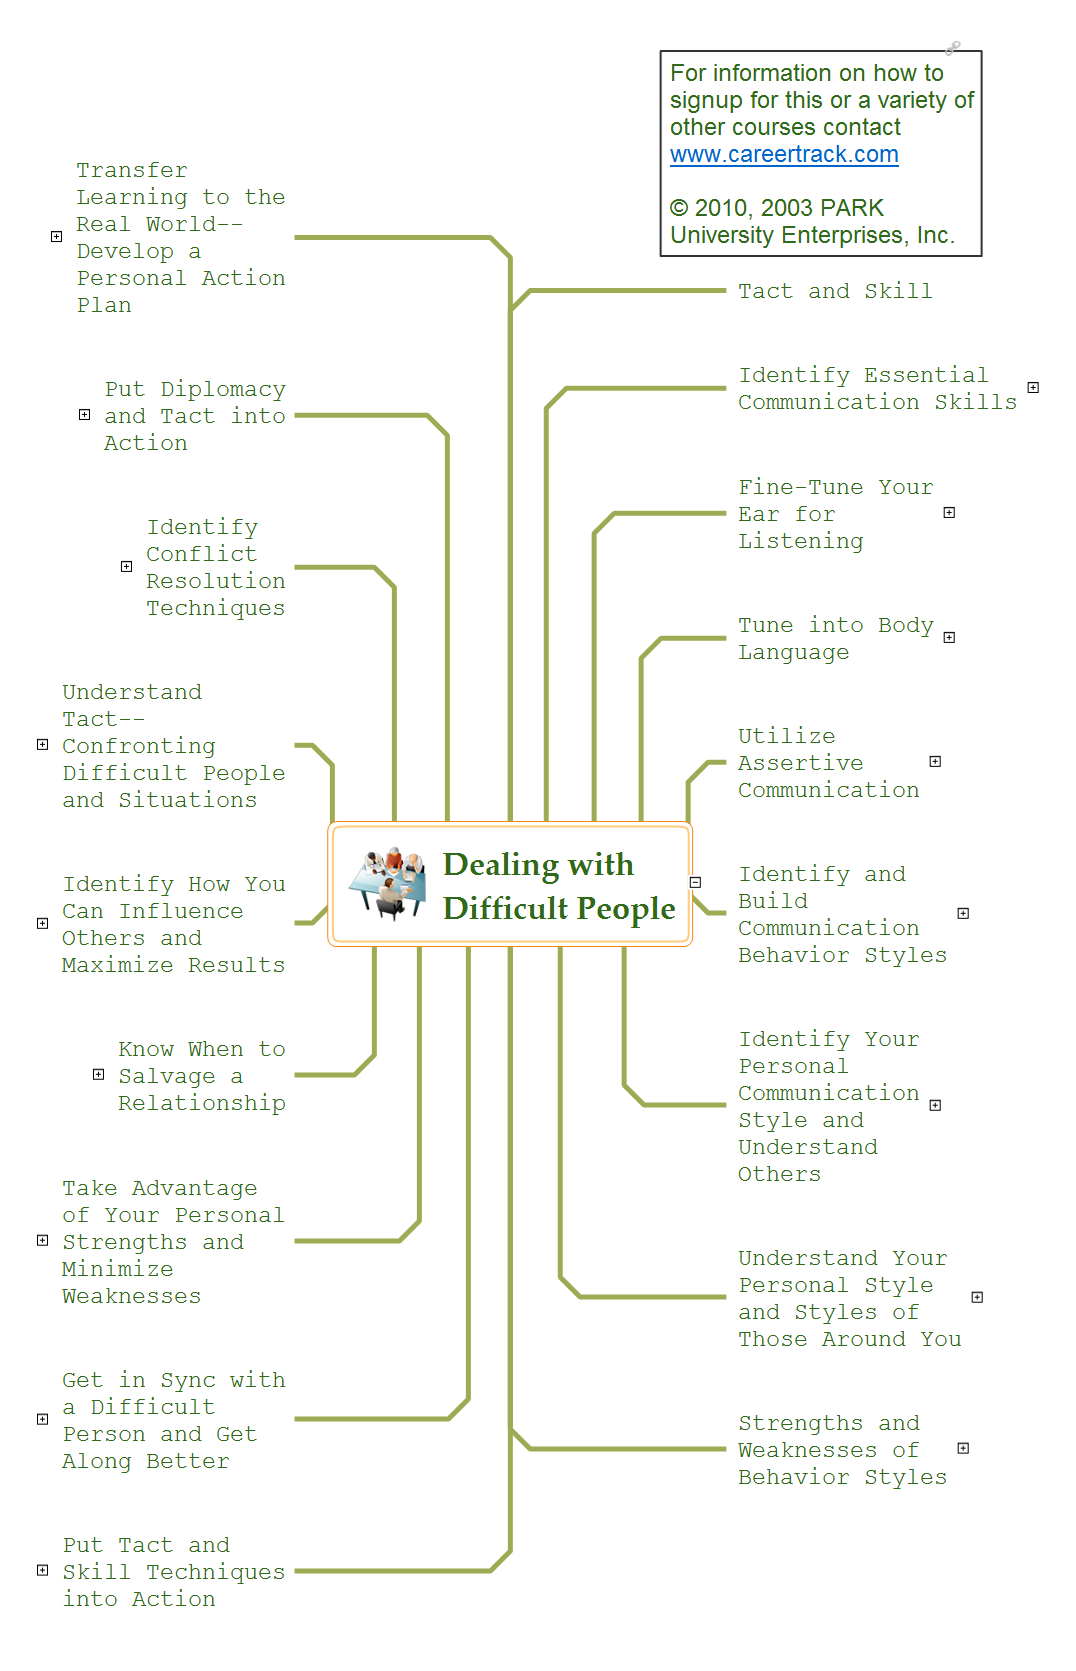
Dealing with Difficult People
Mind map describing the various approaches to take when dealing with difficult people.Affinity Diagram
The Affinity Diagram shows the structure of large, complex factors that have an influence on a problem, and then divides them up into a smaller and simpler structure. The Affinity Diagram does not show a causal relationship between the factors. This diagram is designed to prepare the data for further analysis of the cause-effect relationships.Stakeholder Onion Diagram Template
For depicting the onion model are actively used Stakeholder Onion Diagrams. The ConceptDraw DIAGRAM diagramming and vector drawing software extended with Stakeholder Onion Diagrams Solution from the Management Area of ConceptDraw Solution Park offers the number of useful tools and Stakeholder Onion Diagram template for their easy design.Work Order Process Flowchart. Business Process Mapping Examples
Create your own cross-functional flow charts of order processing steps using variety of vector objects from the libraries of Business Process Mapping Solution for ConceptDraw DIAGRAM Business Mapping Software and also collection of Business Process Maps, Flowcharts, Swim Lanes Diagrams and SIPOC Diagrams, and template from ConceptDraw STORE to create your own professional looking diagramsThe cross-functional flow chart example shows business process mapping of the real property work order.
- Multiple Project Dashboard Template Excel
- How to Export Project Data to MS Excel Worksheet | How to Track ...
- Excel Dashboard Multiple Projects Tracking
- How to Report on Multiple Projects Status | How to Track Your ...
- Excel Project Tracking Dashboard
- How to Track Your Project Plan vs. the Actual Project Condition ...
- Excel Project Gauge
- Project Dashboard For Multiple Projects
- Multi Projects Dashboard
- Multiple Indicator Dashboard
- Project Planner And Dashboard Excel Template Download
- How to Export Project Data to MS Excel Worksheet | How to Track ...
- Project Management Dashboard Excel Free
- How to Track Your Project Plan vs. the Actual Project Condition ...
- Multiple Construction Project Status Report Template Excel
- Dashboard | Performance Indicators | Status Dashboard | Tasks Kpi ...
- Sample Project Dashboard Excel
- Performance Indicators | Excel Progress Gauge
- How to Manage Multiple Projects on Windows | Process Flowchart ...
- How to Manage a Multiple Project Participants Responsibilities with ...
- ERD | Entity Relationship Diagrams, ERD Software for Mac and Win
- Flowchart | Basic Flowchart Symbols and Meaning
- Flowchart | Flowchart Design - Symbols, Shapes, Stencils and Icons
- Flowchart | Flow Chart Symbols
- Electrical | Electrical Drawing - Wiring and Circuits Schematics
- Flowchart | Common Flowchart Symbols