Data structure diagram with ConceptDraw DIAGRAM
Data structure diagram (DSD) is intended for description of conceptual models of data (concepts and connections between them) in the graphic format for more obviousness. Data structure diagram includes entities description, connections between them and obligatory conditions and requirements which connect them. Create Data structure diagram with ConceptDraw DIAGRAM.Data Flow Diagram
Data Flow Diagram (DFD) is the part of the Structured Systems Analysis and Design Methodology (SSADM), which is intended for information systems projection and analysis. Data Flow Diagrams allow graphically represent the data flows in information system and analyze the data processing during the structural projection. This type of diagrams lets visually show a work of information system and results of this work, it is often used in connection with human processes and can be displayed as Workflow diagram. Data Flow Diagram visualizes processes and functions, external entities, data depositories, and data flows connecting these elements and indicating direction and data character. Each of these elements used for DFD has its own graphical notation. There are two notations to draw DFDs - Yourdon & Coad and Gane & Sarson. ConceptDraw DIAGRAM extended with Data Flow Diagrams (DFD) solution from Software Developmant area is ideal for designing professional looking DFDs, which can be then easily exported in various formats.Accounting Data Flow from the Accounting Flowcharts Solution
Accounting Data Flow from the Accounting Flowcharts Solution visually describes the financial accounting process, shows the accumulated information about transactions and events for creating the balance sheet and the final income statement. Accounting Flowcharts Solution contains also a wide variety of templates and samples that you can use as the base for your own Accounting Flowcharts of any complexity.Example of DFD for Online Store (Data Flow Diagram)
Data Flow Diagram (DFD) is a methodology of graphical structural analysis and information systems design, which describes the sources external in respect to the system, recipients of data, logical functions, data flows and data stores that are accessed. DFDs allow to identify relationships between various system's components and are effectively used in business analysis and information systems analysis. They are useful for system’s high-level details modeling, to show how the input data are transformed to output results via the sequence of functional transformations. For description of DFD diagrams are uses two notations — Yourdon and Gane-Sarson, which differ in syntax. Online Store DFD example illustrates the Data Flow Diagram for online store, the interactions between Customers, Visitors, Sellers, depicts User databases and the flows of Website Information. ConceptDraw DIAGRAM enhanced with Data Flow Diagrams solution lets you to draw clear and simple example of DFD for Online Store using special libraries of predesigned DFD symbols.
 Data Flow Diagrams (DFD)
Data Flow Diagrams solution extends ConceptDraw DIAGRAM software with templates, samples and libraries of vector stencils for drawing the data flow diagrams (DFD).
HelpDesk
How to Create a Data Flow Diagram
Data flow diagramming is a highly effective technique for showing the flow of information through a system. Data flow diagrams reveal relationships among and between the various components in a program or system. DFD is an important technique for modeling a system’s high-level detail by showing how input data is transformed to output results through a sequence of functional transformations. The set of standard symbols is used to depict how these components interact in a system. ConceptDraw DIAGRAM allows you to draw a simple and clear Data Flow Diagram using special libraries.Data Modeling with Entity Relationship Diagram
Data modeling is actively applied in analysis and uses wide set of methods for description the data requirements in a system. One of the most popular and well-known is the ERD method of database modeling. The best ERD tool for the Mac and Windows is ConceptDraw DIAGRAM software extended with the Entity-Relationship Diagram (ERD) solution from the Software Development Area for ConceptDraw Solution Park, which is sharpened for professional ERD drawing and data modeling with Entity Relationship Diagram.HelpDesk
How to Connect a Live Object to a Text Data Source
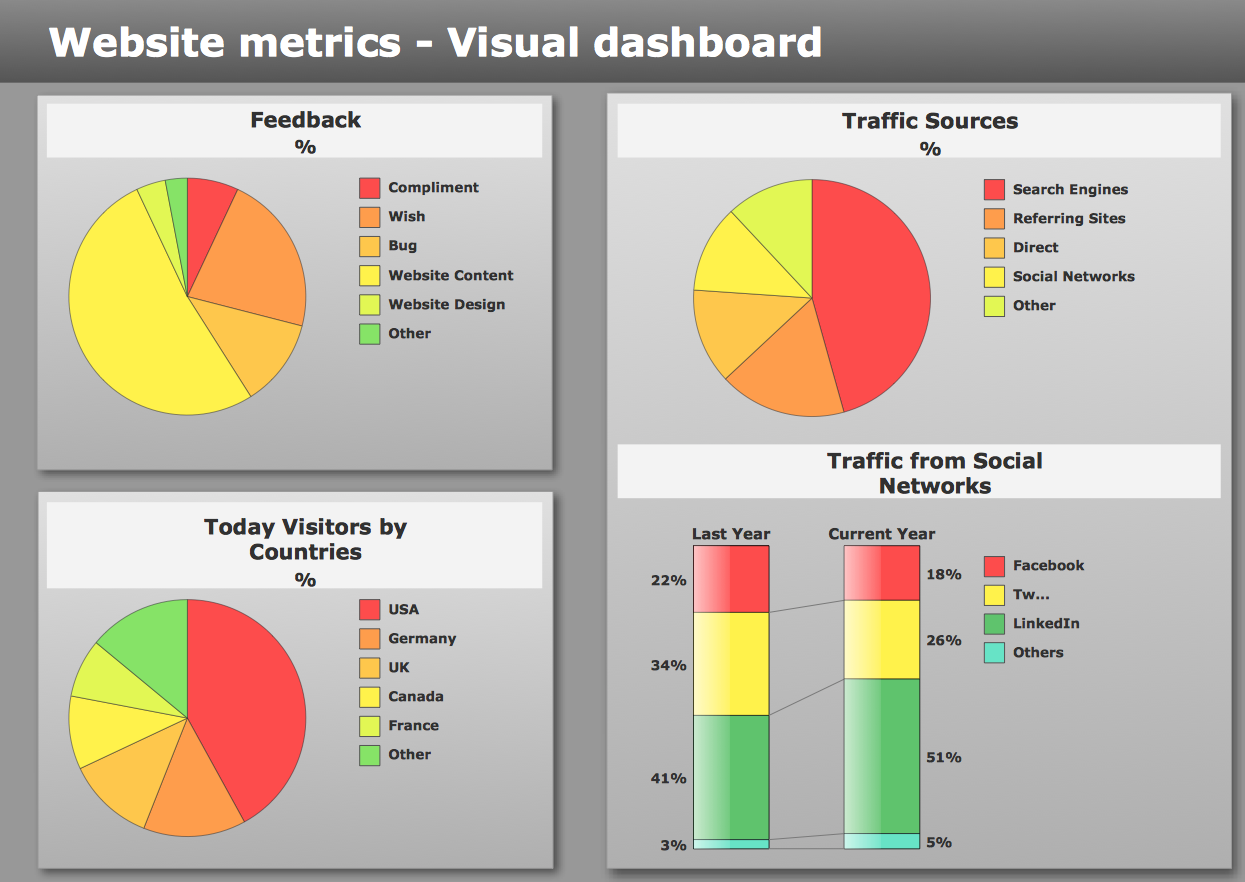
You can easily create a visual dashboard using charts and graphics indicators from Live Objects libraries. Here is an instruction on how to connect a ConceptDraw live object with data source files in TXT format to visualize the actual values of your performance metrics.Data Flow Diagrams
Data Flow Diagram (DFD) is a special chart type which lets graphically illustrate the "flow" of data through an information system. So the Data Flow Diagrams can be successfully used for visualization of data processing or structured design, for creation an overview of the system, for business process modeling, for exploring the high-level design in terms of data flows and documenting the major data flows. Inclusion of powerful Data Flow Diagrams solution to the Software Development area of ConceptDraw Solution Park makes the ConceptDraw DIAGRAM a beneficial data flow diagramming software and supplies it with numerous collection of quick-start templates, professionaly designed samples, and extensive range of ready-for-use vector objects consisting the Data Flow Diagrams, Gane-Sarson Notation, and Yourdon and Coad Notation libraries. Use the ConceptDraw DIAGRAM application to design easy and quickly the Data Flow Diagrams including the data storages, data flows, external entities, functional transforms, control transforms and signals.Data Modeling Diagram
The vector stencils library Activity diagrams from the solution Rapid UML contains specific data modeling symbols for ConceptDraw DIAGRAM diagramming and vector drawing software. The Rapid UML solution is contained in the Software Development area of ConceptDraw Solution Park.Data Flow Diagram Process
Data Flow Diagram (DFD) is a hierarchy of functional processes, connected by data flows. The purpose of this presentation is to show how each process converts its inputs into outputs and to identify relationships between these processes. DFD is convenient way of modeling and construction the information processes, it step-by-step illustrates the flow of information in a process. For construction a DFD traditionally are used two different notations, which appropriate to the methods of Yourdon-Coad and Gane-Sarson. These notations slightly different from each other by graphical representation of symbols for processes, data stores, data flow, external entities. When designing a DFD it is required to decompose the system into the components (sub-systems), for explaining a complex system you may need represent numerous levels. The Data Flow Diagrams solution from ConceptDraw Solution Park contains numerous predesigned DFD symbols for both notations, which help easy and effectively design professional-looking Data Flow Diagrams (DFDs) and DFD Process Diagrams.HelpDesk
How to Input Data from MS Excel Into a Mind Map
Many people apply Excel documents to store data in the form of hierarchical lists. With ConceptDraw MINDMAP you can easily turn the linear structure of an Excel table in a radial structure of mind map ConceptDraw MINDMAP will create a mind map file (CDMZ) from your Excel (XLS) file. If you keep your information in the Microsoft Excel files, you can import them into ConceptDraw MINDMAP, converting the columns and rows to a hierarchically structured mind map. If you have multiple individual sheets in your Excel workbook, ConceptDraw MINDMAP will turn them into a single multi-page mind map. ConceptDraw MINDMAP lets you import an entire Microsoft® Excel file as well as insert data from the selected cells.How to exchange data files of major mind mapping software?
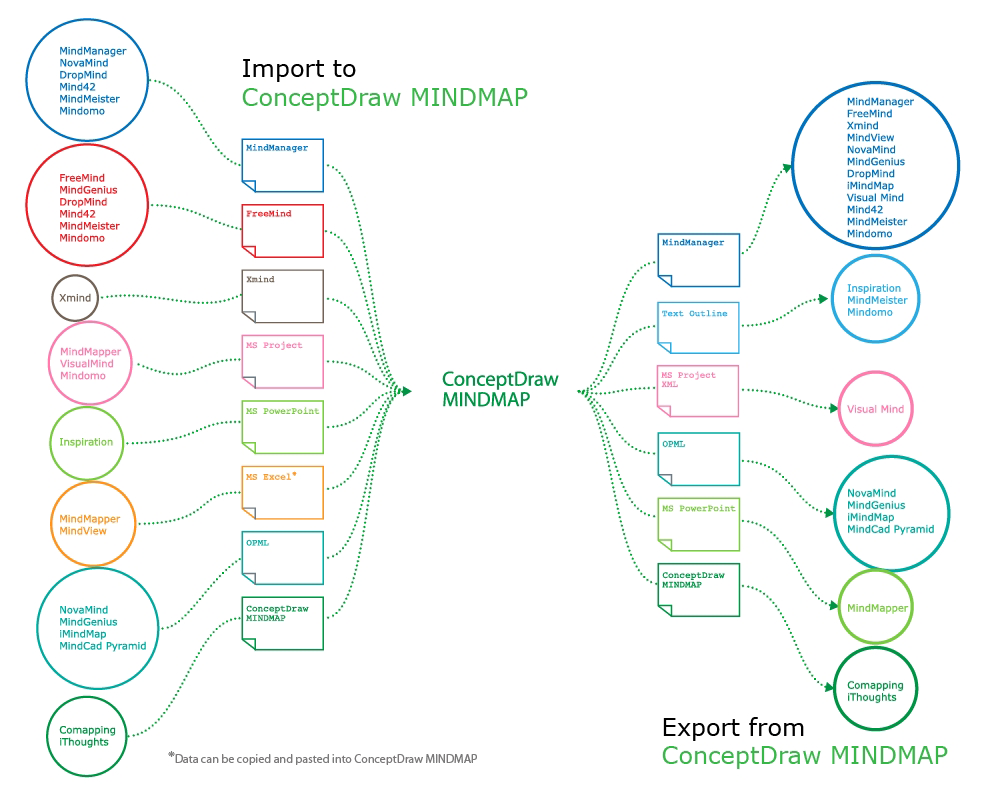
ConceptDraw MINDMAP software included to powerful ConceptDraw Office suite is applied for professional creation the Mind Maps, for effective managing the communications within the work group or team, for holding brainstorming sessions. The ability of exchanging the documents and files of different types, including Mind Maps is very useful for users that need to collaborate, but apply varied applications in their work. ConceptDraw MINDMAP supports the export to many Microsoft Office products, such as MS Word, MS PowerPoint, MS Project, as well as export to PDF, HTML, Evernote, Apple iCal, and different graphic format files. The Mind Map Exchange solution from the Collaboration area of ConceptDraw Solution Park makes the ConceptDraw MINDMAP software powerful in questions of exchanging the Mind Maps with large variety of major mind mapping applications, including Mindjet MindManager, FreeMind, XMind. If you can't to find some file format you need at the import / export list, you can refer to the third party applications to import or export the files through them.Data Flow Diagrams
The information system manages the flow of data introduced into the system. To graphically represent and document the flow of data through some information system is used a Data Flow Diagram (DFD). DFD is a way to visualize the flow of data or data processing, to clearly demonstrate what type of data or information is transferred, where they come from and where are sent. It lets to create an overview of the system, to depict the major steps, and effectively model the processes. DFDs are helpful for analyzing and modifying the business systems. Traditionally are used two notations for DFDs creation - Yourdon-Coad and Gane-Sarson. ConceptDraw DIAGRAM software offers a special Data Flow Diagrams solution from Software Development area, which enables to quickly and simply create professional Data Flow Diagrams including the data storage, data flows, external entities, functional transforms, control transforms and signals. Use the offered templates, samples and extensive range of libraries to design your own Data Flow Diagrams in minutes.Data Flow Diagram Software
Data Flow Diagrams (DFDs) are successfully used when studying the business processes or systems that involve the transfer of data. They are a visual way to represent the data processing, to model and visualize the flow of data through a computer system and functional requirements for a designed system. They are the good business modeling tool to describe the business events and interactions, the physical systems involving the storage and transfer of data. ConceptDraw DIAGRAM supplied with Data Flow Diagrams solution from Software Development area of ConceptDraw Solution Park is a modern and powerful data flow diagram software. This solution offers large set of predesigned DFD vector objects, grouped to three libraries: Data Flow Diagrams, Gane-Sarson Notation, and Yourdon and Coad Notation. All they and also collection of DFD samples and built-in templates make a good base for ConceptDraw DIAGRAM users, providing them all conditions for easy creation the Data Flow Diagrams and Data Flow Models of any complexity.Data Flow Diagram Symbols. DFD Library
Data Flow Diagrams graphically represent the information transfers and process steps of a system. They visually depict how data are processed by a system in terms of inputs and outputs, how occurs the input in a system, how the data flow through an information system and where they are stored, and how occurs output from the system. DFDs give the overview of the system and models the processes aspects, they are maintained with other methods of structured systems analysis. The main goal of DFDs is achievement of understanding between developers and users. For their construction are used two notations - Gane-Sarson and Yourdon, each of them uses its own set of symbols. Data Flow Diagrams solution from Software Development area extends the ConceptDraw DIAGRAM software with templates, samples, and predesigned libraries of data flow diagram symbols for both notations, allowing you easy design the process-oriented and data-oriented models, draw the Data Flow Diagrams, Data Flowcharts, Data Process Diagrams, Information Flow Diagrams, Structured Analysis Diagrams, etc.HelpDesk
How to Create Data-Driven Infographics
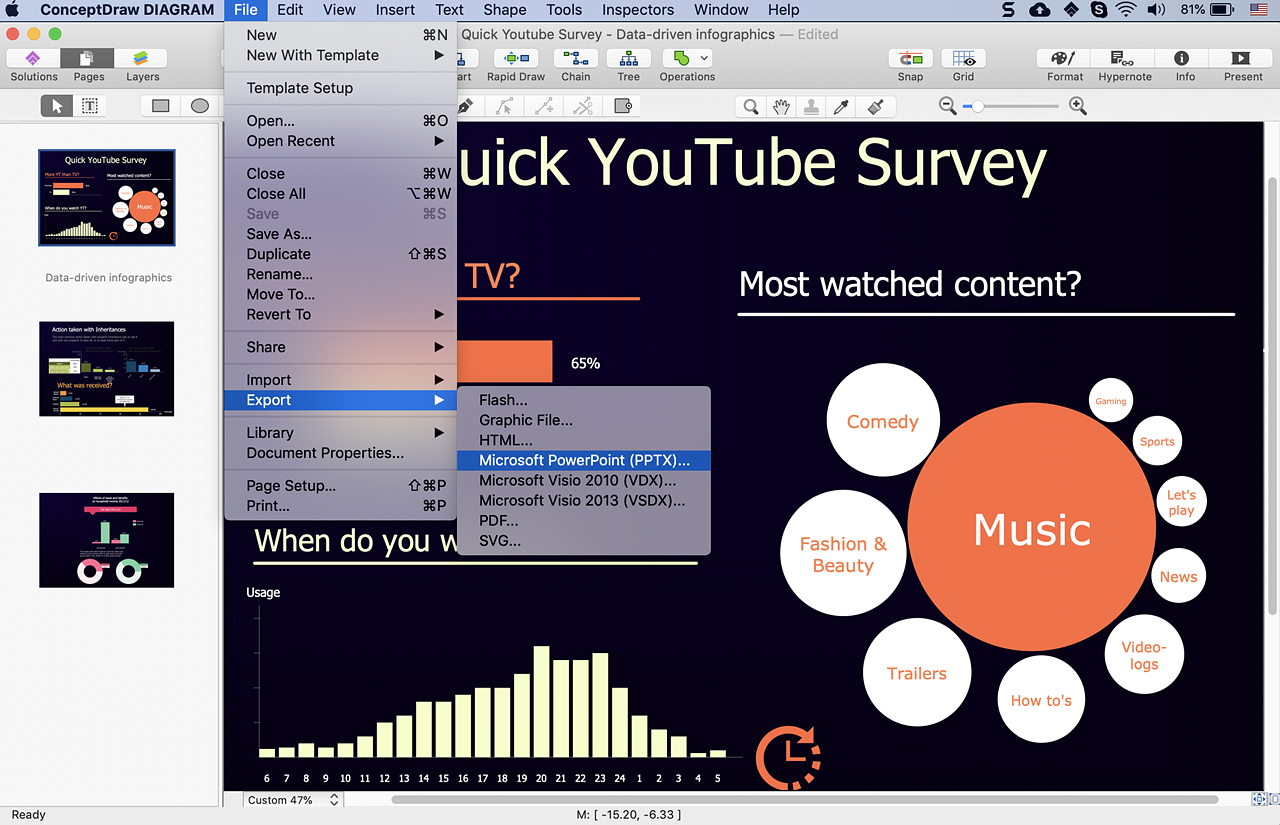
Data-driven infographics are used in wildly disparate areas of business and commerce. To make effective Data-driven infographics, it's useful to have a wide variety of graphical elements — icons, clipart, stencils, charts, and graphs — to illustrate your diagram. ConceptDraw Data-driven Infographics solution provides all the tools you need to present data as described by this article — as well as the charts mentioned previously, you can find histograms, divided bar charts, ring charts, line graphs, and area charts — meaning you can find the perfect medium for displaying a certain type of data. It allows you to draw data-driven infographics quickly and easily using the special templates and vector stencils libraries. It can be used to quickly communicate a message, to simplify the presentation of large amounts of data, to see data patterns and relationships, and to monitor changes in variables over time.Design Data Flow. DFD Library
Data flow diagram or DFD is a type of diagrams used for graphical representation the "flow" of data through an information system, for effective modeling its process aspects and for visualization the data processing. They are one of the best tools for clearly making an overview of the system that will be developed, for depiction in details what kinds of information will be inputted to the system and outputted from it, where they will be stored, and other details. ConceptDraw DIAGRAM software with Data Flow Diagrams solution from Software Development area of ConceptDraw Solution Park is powerful in a field of designing the DFDs. Three libraries containing 49 vector DFD shapes and symbols are offered by Data Flow Diagrams (DFD) solution. Use them to design data flow diagrams, information flow diagrams, data flowcharts, data process diagrams, structured analysis diagrams, to create the data-oriented models or process-oriented models, and so on. Pay also attention for the included collection of DFD samples, examples and built-in templates at ConceptDraw STORE.Structured Systems Analysis and Design Method. SSADM with ConceptDraw DIAGRAM
Structured Systems Analysis and Design Method (abbr. SSADM) is a method developed in Great Britain and accepted in 1993 as a national standard for information systems development and analysis. SSADM is based on Data Flow Diagrams and is characterized with presence of clear sequence of steps at projecting, analysis, and documenting of information system. It involves 6 main stages: analysis of existing system or estimation of practicability, requirements definition, determination of technical requirements and equipment cost, development of logical data model, projecting of logical requirements and specification them, physical projecting. Each of them is also divided into several steps defining the tasks that should be fulfilled at a given stage. The most important SSADM elements are flows modeling with help of DFD, data logic modeling with help of LDS (Logical Data Structure) and description of entities behavior. Applying of SSADM is easy with ConceptDraw DIAGRAM diagramming and vector drawing software and Data Flow Diagram solution.DFD Library System
The Data Flow Diagram (DFD) is a graphical technique used for effective modeling and analyzing the information processes and systems. Having at the disposal the DFD library system and newest powerful tools of ConceptDraw DIAGRAM diagramming and vector drawing software supplied with Data Flow Diagrams (DFD) solution from the Software Development area of ConceptDraw Solution Park, you can design fast and easy the Data flow diagrams, Data flowcharts, Data flow models, Data flow process diagrams, Process-oriented models, Data-oriented models, Data process diagrams, Structured analysis diagrams, Information flow diagrams of any type and complexity. For designing the Data Flow Diagrams in ConceptDraw DIAGRAM software are used the simple DFD flowchart symbols from the offered DFD libraries - Data Flow Diagram (DFD) library, Yourdon and Coad Notation library, and Gane-Sarson Notation library. The DFD objects are need to be connected each other by the arrows to depict the data flow from one step to another, that you can do in seconds in ConceptDraw DIAGRAM , as well as set desired design of your diagram.- Difference Between Data Flow Diagram And Architecture Diagram
- Basic Flowchart Symbols and Meaning | Data Flow Diagrams ...
- Example of DFD for Online Store ( Data Flow Diagram) | Basic ...
- Data Flow Diagram Process | Why Flowchart Important to ...
- Data Flow Diagram | Process Flowchart | Swim Lane Diagrams ...
- Data Flow Diagram Symbols. DFD Library | Example of DFD for ...
- DFD Library System | Data Flow Diagram Symbols. DFD Library ...
- Communication network diagram | Network Diagramming with ...
- Accounting Data Flow from the Accounting Flowcharts Solution ...
- Organizational Structure | Data Flow Diagram | Organizational ...
- Data Flow Diagrams (DFD) | Telecommunication Network Diagrams ...
- Competitor Analysis | Pyramid Chart Examples | Accounting Data ...
- Data Flow Diagram Symbols. DFD Library
- Example of DFD for Online Store ( Data Flow Diagram) DFD ...
- Data structure diagram with ConceptDraw PRO | Entity-Relationship ...
- Data Flow Diagram | Process Flowchart | Structured Systems ...
- CS Odessa Announces Data -driven Infographics Solution for ...
- Basic Flowchart Symbols and Meaning | Data Flow Diagram ...
- DFD - Process of account receivable | Data structure diagram with ...
- Enterprise Architecture Diagrams | Data Flow Diagrams (DFD) | Data ...


