Business Report Pie. Pie Chart Examples
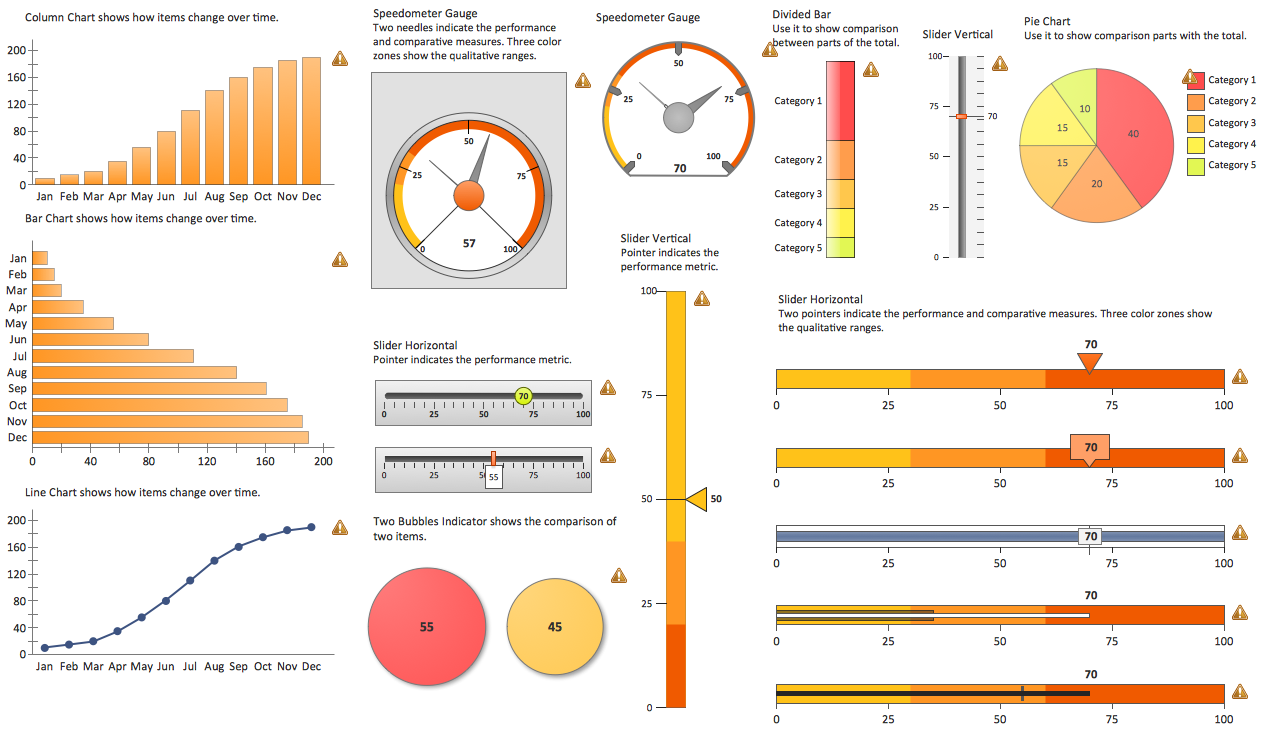
This sample shows the Business Report Pie Chart. The Pie Chart visualizes the data as the proportional parts of a whole, illustrates the numerical proportion. Pie Charts are very useful in the business, statistics, analytics, mass media.
 Visual Reports
The Visual Reports solution extends abilities of ConceptDraw PROJECT by creating the illustrative, informative, colourful and comprehensible reports on a project in a form of visual graphs and diagrams of common types, such as Bar Charts, Pie Charts, Line Charts, Divided Bar Charts, Timelines, Dial Dashboards. This highly effective project management tool helps project managers and other stakeholders to report about the tasks statuses, the project progress and degree of its completion, to evaluate the project status, to depict the project expenses by days and to define the days that go beyond the budget, to compare visually the actual expenses and expected ones at the project planning stage, to generate the Resource chart depicting the utilization of project resources by days, and to show other useful information. The set of tailor-made examples developed for the Visual Reports solution allows designating advantages of each type of report included to this solution for the further use in your management work.
 Website Wireframe
The innovative Website Wireframe solution enhances the ConceptDraw DIAGRAM functionality with newest wireframe tools, libraries with variety of predesigned icons, symbols, buttons, graphics, forms, boxes, and many other vector elements, templates and professionally designed samples, which make it the best wireframing software. Website Wireframe solution gives you significant advantages when designing and maintaining websites, creating skeletal and content-free depictions of website structure, making website prototypes and planning the content arrangement before committing to design, also speeds up the processes of sketching, producing and sharing wireframe examples of website style and interface design.
Business Calendar
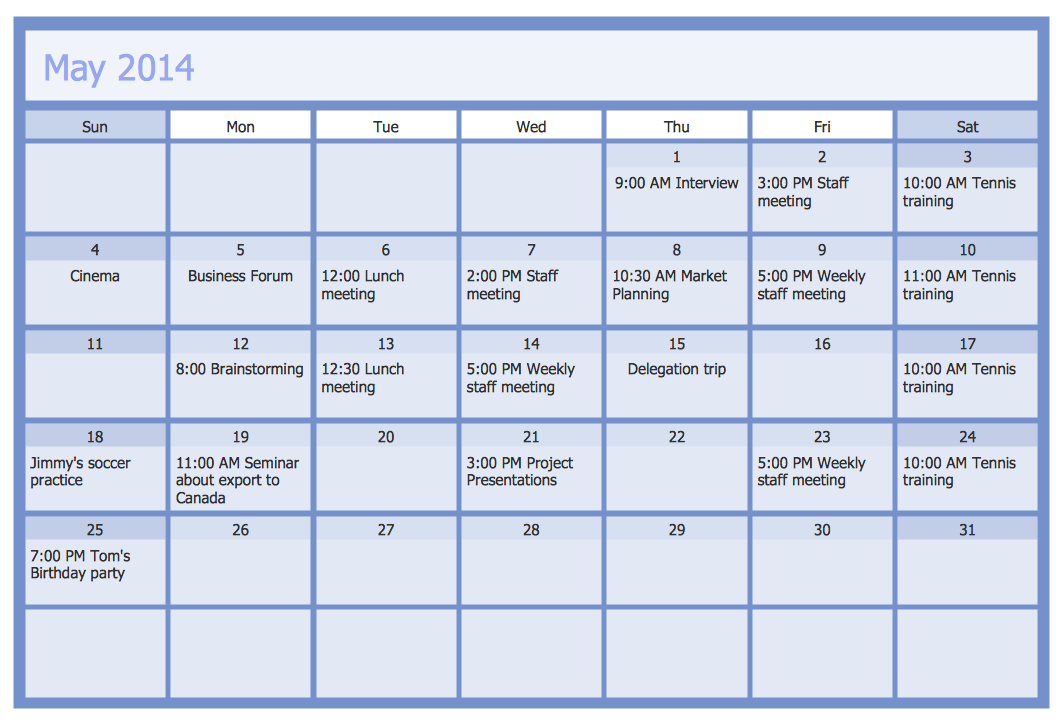
Business calendar is a special type of calendar, it must be functional, convenient for scheduling the affairs and meetings, and also must have strict, official and unobtrusive interface. So you must pay special attention to the business calendar design. Now you don't need to be an artist to design business calendar thanks to the unique drawing tools of Calendars Solution for ConceptDraw DIAGRAM diagramming and vector drawing software.
 MINDMAP Reports
The MINDMAP Reports solution extends the boundaries of interrelations between the ConceptDraw MINDMAP and ConceptDraw PROJECT applications. After planning your projects in a project management software, you can then implement them and display the reports in a graphical format of visual Mind Maps. Intended for all project managers, team leaders, management assistants, and other project participants, this solution offers the set of project examples and a wide choice of report kinds, which you can generate in a moment in a form of Mind Map document to track visually your project results and progress, to analyze the work of project team and individual employees, to control the tasks' execution, including the top level and critical tasks, the project milestones and many other key project parameters.
 Resource Usage Reports
The Resource Usage Reports solution supplies the ConceptDraw PROJECT software with a large set of useful project examples and extensive reporting abilities in resources planning, their allocation and use. The reports offered by this solution allow all project management specialists to study in detail the use of company's resources in a specific project, to evaluate their efficiency, productivity, sufficiency of their use, to detect in time the problems in resources allocation within a project or a group of projects, and to eliminate detected irrationalities in resource usage and loss of working time. Choosing the report type that suits your management needs better, you can receive the information for different time periods (week, month, etc.) about resources involved in a project, their usage and tasks on which they are assigned, about workloads of employees in tasks in hours or in per cent during a fixed period of time, project’s overloaded or underloaded work resources and overallocation periods, about material resources assignments for projects and their utilization by tasks, and other information.
Line Chart Template for Word
This sample was created in ConceptDraw DIAGRAM diagramming and vector drawing software using the Line Graphs Solution from Graphs and Charts area of ConceptDraw Solution Park. This sample shows the Line Chart of annual percentage change. The Line Chart allows you to clearly see the changes of data over the time.Reporting & Data Visualization
Using professional reporting and data visualization is the way your business can improve. ConceptDraw Sales Dashboard solution allows you produce live dashboards show KPI to monitor you sales activity and results in real time.
 Cash Flow Reports
The Cash Flow Reports solution extends the ConceptDraw PROJECT software with the abilities to generate three kinds of management reports in a form of spreadsheets: Cash Flow on Projects, Cash Flow on Resources, and Cash Flow on Tasks. Use them to monitor and to control the cash flow in projects and multiprojects, the project expenses by days, by resources, by tasks, and to analyze effectively the project progress and the compliance of project finances to allocated budget. Having a full content and ideal view, these reports are popular with the project planning and project management teams, project participants, team leaders, and project managers which have the need for demonstrating the steps of work on projects and reporting about project progress in printed reports or on a large screen. The projects examples included in this solution are illustrative and perfectly suit for comprehending all the solution's capabilities.
Bar Diagrams for Problem Solving. Create manufacturing and economics bar charts with Bar Graphs Solution
Create bar charts for visualizing problem solving in manufacturing and economics using the ConceptDraw DIAGRAM diagramming and vector drawing software extended with the Bar Graphs Solution from the Graphs and Charts area of ConceptDraw Solition Park.
 Project Management Area
Project Management area provides Toolbox solutions to support solving issues related to planning, tracking, milestones, events, resource usage, and other typical project management functions.
 Business Diagrams Package
Business Diagrams Package is a large set of comprehensive graphical solutions from the ConceptDraw Solution Park, which are powerful in solving the business, marketing and quality tasks in completely different fields, such as finance, education, health food and cooking, HR, and many others. The tools of this package's solutions are a powerful assistant in drawing all diversity of Financial and Marketing infographics, Business process workflow diagrams, Organizational charts, Education infographics, Quality diagrams, Health food diagrams, HR flowcharts, as well as different graphics and charts, which depict the values of key business indicators, their dependencies, give the full understanding of a situation within a company and on the market.
Reporting Dashboard Software for Business
An effective way to improve your business is using reporting dashboard software. ConceptDraw DIAGRAM software extended with the Sales Dashboard solution helps you monitor all KPI on the one screen in real time.
 Accounting Flowcharts
Accounting Flowcharts solution extends ConceptDraw DIAGRAM software with templates, samples and library of vector stencils for drawing the accounting flow charts.
Sales Dashboards for Your Company
ConceptDraw DIAGRAM software extended with the Sales Dashboard solution allows you produce sales dashboards for your company easily. You can start from samples and templates delivered with the solution and then modify them to get a dashboard that suites your specific needs.
 AWS Architecture Diagrams
AWS Architecture Diagrams with powerful drawing tools and numerous predesigned Amazon icons and AWS simple icons is the best for creation the AWS Architecture Diagrams, describing the use of Amazon Web Services or Amazon Cloud Services, their application for development and implementation the systems running on the AWS infrastructure. The multifarious samples give you the good understanding of AWS platform, its structure, services, resources and features, wide opportunities, advantages and benefits from their use; solution’s templates are essential and helpful when designing, description and implementing the AWS infrastructure-based systems. Use them in technical documentation, advertising and marketing materials, in specifications, presentation slides, whitepapers, datasheets, posters, etc.
Waterfall Bar Chart
Waterfall chart shows the changing of the value from one state to another through the series of intermediate changes. The waterfall diagrams are widely used in the business. They are used to represent the set of figures and allow link the individual values to the whole.
 Wireless Networks
The Wireless Networks Solution extends ConceptDraw DIAGRAM software with professional diagramming tools, set of wireless network diagram templates and samples, comprehensive library of wireless communications and WLAN objects to help network engineers and designers efficiently design and create Wireless network diagrams that illustrate wireless networks of any speed and complexity, and help to identify all required equipment for construction and updating wireless networks, and calculating their costs.
 Audit Flowcharts
Audit flowcharts solution extends ConceptDraw DIAGRAM software with templates, samples and library of vector stencils for drawing the audit and fiscal flow charts.
 PM Dashboards
The PM Dashboards solution extends the management boundaries of ConceptDraw DIAGRAM and ConceptDraw PROJECT products with an ability to demonstrate changes to the budget status, to show the project progress toward its objectives, to display clearly the identified key performance indicator (KPI) or the set of key performance indicators for any project. This solution provides you with examples and ability to generate three types of visual dashboards reports based on your project data Project Dashboard, Tactical Dashboard, and Radar Chart. By dynamically charting the project’s key performance indicators that are collected on one ConceptDraw DIAGRAM document page, all project participants, project managers, team members, team leaders, stakeholders, and the entire organizations, for which this solution is intended, have access to the daily status of projects they are involved in.
- Bar Graphs | Business Bar Graph
- Line Graphs | Basic Line Graphs | Business Line Graph
- Business Circle With Graph
- Column Graph For Business
- Business Report Pie. Pie Chart Examples | ConceptDraw Solution ...
- Financial Comparison Chart | Business Report Pie. Pie Chart ...
- Business Report Pie. Pie Chart Examples | Examples of Flowcharts ...
- Business Report Pie. Pie Chart Examples | One formula of ...
- Bar Graphs | Line Graph Charting Software | How to Draw a Line ...
- Chart Maker for Presentations | Percentage Pie Chart. Pie Chart ...
- Business Report Pie. Pie Chart Examples | How to Create ...
- Percentage Pie Chart. Pie Chart Examples | Pie Graph Worksheets ...
- Percentage Pie Chart. Pie Chart Examples
- Atmosphere air composition | Percentage Pie Chart. Pie Chart ...
- Marketing Management Graph
- Example Of Pie Chart For The Cost Of The Project
- Business Report Pie. Pie Chart Examples | Pie Chart Word Template ...
- Triangular Graph Template
- How to Draw an Organization Chart | Technical Flow Chart ...


