Sales Growth. Bar Graphs Example

Bar Diagrams for Problem Solving. Create business management bar charts with Bar Graphs Solution

 Bar Graphs
The Bar Graphs solution enhances ConceptDraw PRO v10 functionality with templates, numerous professional-looking samples, and a library of vector stencils for drawing different types of Bar Graphs, such as Simple Bar Graph, Double Bar Graph, Divided Bar Graph, Horizontal Bar Graph, Vertical Bar Graph, and Column Bar Chart.
Bar Diagrams for Problem Solving. Create economics and financial bar charts with Bar Graphs Solution

Column Chart Examples

Create Graphs and Charts

Bar Diagrams for Problem Solving. Create manufacturing and economics bar charts with Bar Graphs Solution

Financial Comparison Chart

Bar Diagrams for Problem Solving. Create event management bar charts with Bar Graphs Solution

Bar Graph

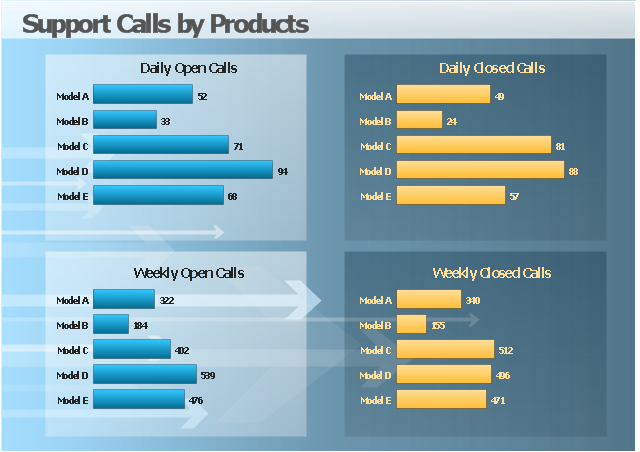
The business dashboard example "Support calls by products" contains 4 horizontal bar charts used for the comparison of support calls data by products.
"A bar chart or bar graph is a chart with rectangular bars with lengths proportional to the values that they represent. The bars can be plotted vertically or horizontally. A vertical bar chart is sometimes called a column bar chart. ...
A bar graph is a chart that uses either horizontal or vertical bars to show comparisons among categories. One axis of the chart shows the specific categories being compared, and the other axis represents a discrete value." [Bar chart. Wikipedia]
The visual dashboard example "Support calls by products" was created using the ConceptDraw PRO diagramming and vector drawing software extended with the Comparison Dashboard solution from the area "What is a Dashboard" of ConceptDraw Solution Park.
Visual dashboard
Rainfall Bar Chart

Business Report Pie. Pie Chart Examples

Column Chart Software

Bar Chart Examples

- Business Bar Graph
- Sales Growth. Bar Graphs Example | Business Report Pie. Pie Chart ...
- Bar Graphs | Bar Diagrams for Problem Solving. Create business ...
- Bar Graphs In Businesses
- Bar Diagrams for Problem Solving. Create business management ...
- Business Reporting Graphs
- Bar Graphs | Chart Examples | Column Chart Examples | Crime In ...
- Bar Graphs | Bar Diagrams for Problem Solving. Create ...
- Business Report Pie. Pie Chart Examples | Sales Growth. Bar ...
- What Is Bar Graph In Business
- Bar Graph About Business
- Sales Growth. Bar Graphs Example | Financial Comparison Chart ...
- Business Bargraph
- Bar Chart Examples | Bar Graph | Business Report Pie. Pie Chart ...
- Bar Graph Complete Solution
- Business Report With Bar Graph
- Create Graphs and Charts | Bar Diagrams for Problem Solving ...
- Business Sales Bar Graph
- Sales Growth. Bar Graphs Example | Column Chart Examples ...