Pyramid Diagram and Pyramid Chart

Fundraising Pyramid

Pyramid Diagram

Pyramid Chart Examples

Pyramid Diagram

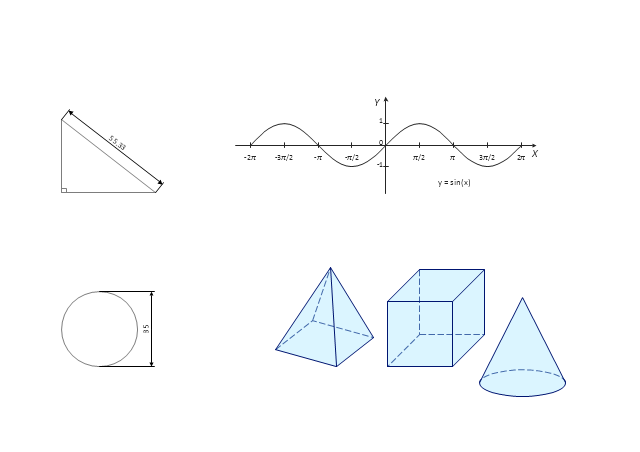
Use this mathematical drawings and graphs template to create your own math illustrations using the shapes of plane and solid geometric figures as well as trigonometric functions.
"Mathematical visualization or mathematical visualization is an aspect of geometry which allows one to understand and explore mathematical phenomena via visualization. Classically this consisted of two-dimensional drawings or building three-dimensional models (particularly plaster models in the 19th and early 20th century), while today it most frequently consists of using computers to make static two or three dimensional drawings, animations, or interactive programs. Writing programs to visualize mathematics is an aspect of computational geometry." [Mathematical visualization. Wikipedia]
The math illustrations template for the ConceptDraw PRO diagramming and vector drawing software is included in the Mathematics solution from the Science and Education area of ConceptDraw Solution Park.
Mathematical drawings and graphs
Pyramid Charts

Chart Templates

How to Create a Pyramid Diagram

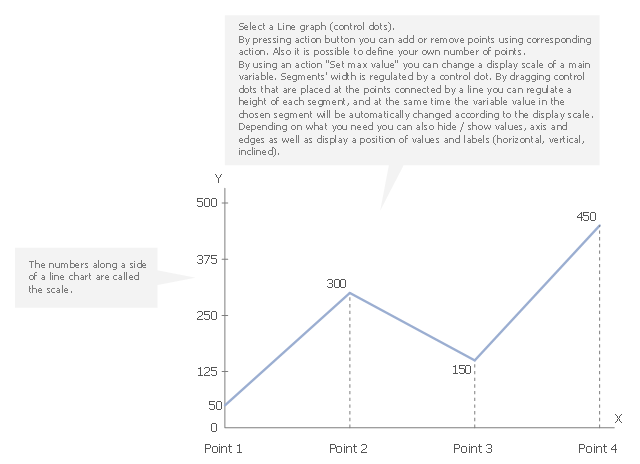
This line graph templates shows the number of tourists visiting the resort town for six months. Use it to design your time series line charts in ConceptDraw PRO diagramming and vector drawing software.
"A time series is a sequence of data points, measured typically at successive points in time spaced at uniform time intervals. ... Time series are very frequently plotted via line charts. Time series are used in statistics, signal processing, pattern recognition, econometrics, mathematical finance, weather forecasting, earthquake prediction, electroencephalography, control engineering, astronomy, and communications engineering. Time series analysis comprises methods for analyzing time series data in order to extract meaningful statistics and other characteristics of the data. Time series forecasting is the use of a model to predict future values based on previously observed values. While regression analysis is often employed in such a way as to test theories that the current values of one or more independent time series affect the current value of another time series, this type of analysis of time series is not called "time series analysis", which focuses on comparing values of time series at different points in time. Time series data have a natural temporal ordering." [Time series. Wikipedia]
The chart template "Line graph" is included in the Basic Line Graphs solution from the Graphs and Charts area of ConceptDraw Solution Park.
Chart template
Line Chart Template for Word

How to Create a Pie Chart

Pie Chart Examples and Templates

Rainfall Bar Chart

Energy Pyramid Diagram

- Triangle chart - Template | Triangular chart - Template | Pyramid ...
- Pyramid Graph Template
- Divided Triangle Graph
- Pyramid Diagram | 3D Triangle diagram - Template | Pyramid ...
- Circular Flow Diagram Template | Triangle scheme with arrows ...
- Triangular Based Pyramid Template
- 3d Triangle Chart
- Triangular Venn diagram - Template | Pyramid Charts | Line Chart ...
- 3d Graph Triangle
- Free Flow Pyramid Charts Templates
- Pyramid Chart Template
- Triangle diagram - Template | Triangle chart - Template | 3D ...
- Triangle Template For A Pyramid
- Triangle Pie Chart
- Triangle Chart
- Chart For Triangular Pyramid
- 3D Triangle diagram - Template | Pyramid Diagram | 3D Segmented ...
- Fundraising Pyramid | Chart Templates | Chart Examples ...
- Line Chart Template for Word | How to Draw a Scatter Diagram ...