Pyramid Diagram and Pyramid Chart

The template "4-Level 3D pyramid diagram" for the ConceptDraw PRO diagramming and vector drawing software is included in the Pyramid Diagrams solution from the Marketing area of ConceptDraw Solution Park.
www.conceptdraw.com/ solution-park/ marketing-pyramid-diagrams
www.conceptdraw.com/ solution-park/ marketing-pyramid-diagrams
Pyramid diagram
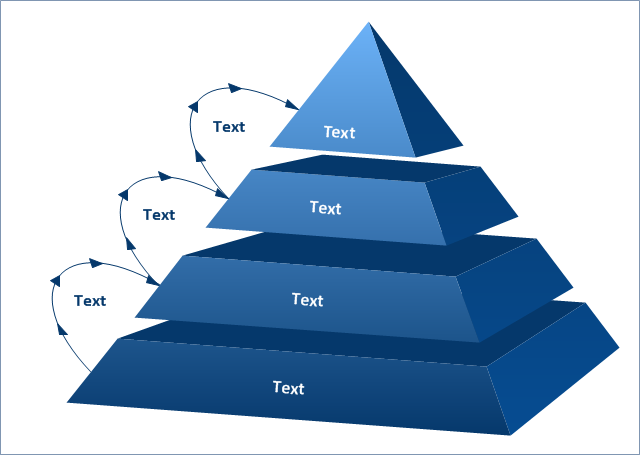
Use this segmented pyramid diagram template to create your own marketing triangular diagrams using the ConceptDraw PRO diagramming and vector drawing software.
The segmented pyramid chart template is included in the Pyramid Diagrams solution from the Marketing area of ConceptDraw Solution Park.
www.conceptdraw.com/ solution-park/ marketing-pyramid-diagrams
The segmented pyramid chart template is included in the Pyramid Diagrams solution from the Marketing area of ConceptDraw Solution Park.
www.conceptdraw.com/ solution-park/ marketing-pyramid-diagrams
Segmented pyramid chart

Pyramid Charts

Energy Pyramid Diagram

Pyramid Chart Examples

Pyramid Diagram

Chart Templates

How to Create a Pyramid Diagram

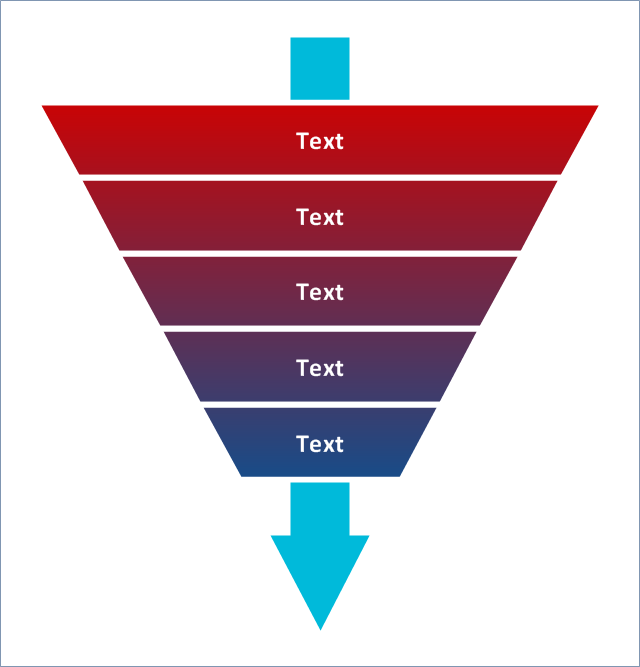
Use this 5-level funnel diagram template to quickly create your own marketing funnel diagrams using the ConceptDraw PRO diagramming and vector drawing software.
The 5-level funnel diagram template is included in the Pyramid Diagrams solution from the Marketing area of ConceptDraw Solution Park.
www.conceptdraw.com/ solution-park/ marketing-pyramid-diagrams
The 5-level funnel diagram template is included in the Pyramid Diagrams solution from the Marketing area of ConceptDraw Solution Park.
www.conceptdraw.com/ solution-park/ marketing-pyramid-diagrams
Funnel diagram
Pyramid Diagram

Fundraising Pyramid

Pyramid Diagram

Pie Chart Examples and Templates

Chart Maker for Presentations

- Pyramid Chart Template
- Triangle chart - Template | Triangular chart - Template | Pyramid ...
- Pyramid diagram - Template
- 6-Level 3D pyramid diagram - Template | Pyramid Diagram ...
- Triangle Graph Template
- Pyramid Diagram and Pyramid Chart | Pyramid Diagram ...
- Six Markets Model Chart Template | Target Diagram | Pyramid ...
- Pyramid Diagram Template
- Pyramid Diagram | 3D Triangle diagram - Template | How to Create ...
- Free Flow Pyramid Charts Templates
- Triangular Graph Template
- Triangular Venn diagram - Template | Pyramid Diagram | Pyramid ...
- Pyramid Diagram and Pyramid Chart | Basic Diagramming | Chart ...
- 3D Triangle diagram - Template | Pyramid Diagram | 3D Segmented ...
- Pyramid Diagram and Pyramid Chart | Segmented pyramid diagram ...
- Pie Chart Word Template . Pie Chart Examples | Pyramid Diagram ...
- 4-level 3D pyramid diagram - Template | 2-Level 3D pyramid ...
- Venn Diagram | How to Create a Pyramid Diagram | Triangular Venn ...
- Pyramid Diagram and Pyramid Chart | Pyramid Charts | Pie Chart ...