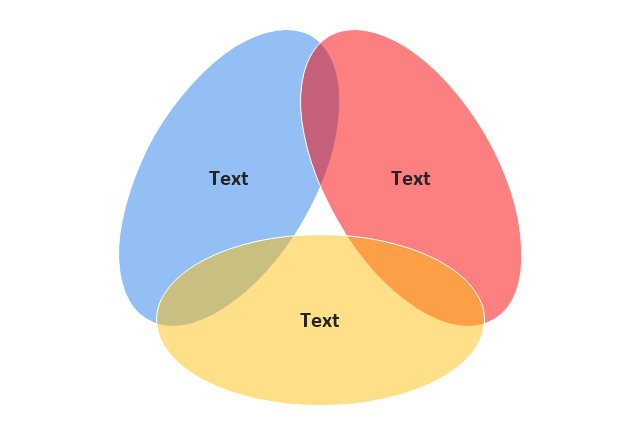
Venn Diagram

How to Create a Pyramid Diagram

Use this triangular Venn diagram template to create your own marketing pyramid diagrams using the ConceptDraw PRO diagramming and vector drawing software.
The triangular Venn diagram template is included in the Pyramid Diagrams solution from the Marketing area of ConceptDraw Solution Park.
www.conceptdraw.com/ solution-park/ marketing-pyramid-diagrams
The triangular Venn diagram template is included in the Pyramid Diagrams solution from the Marketing area of ConceptDraw Solution Park.
www.conceptdraw.com/ solution-park/ marketing-pyramid-diagrams
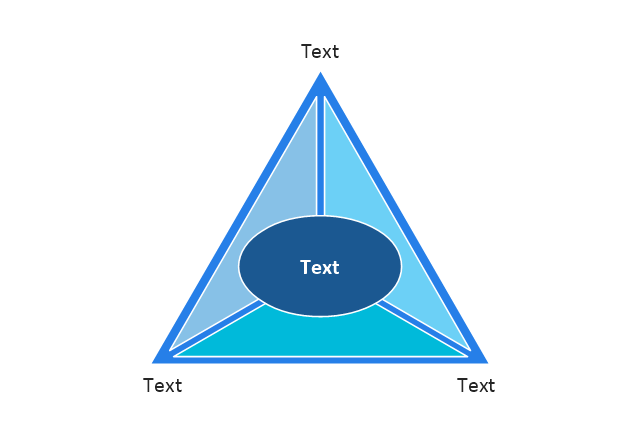
Triangular Venn diagram

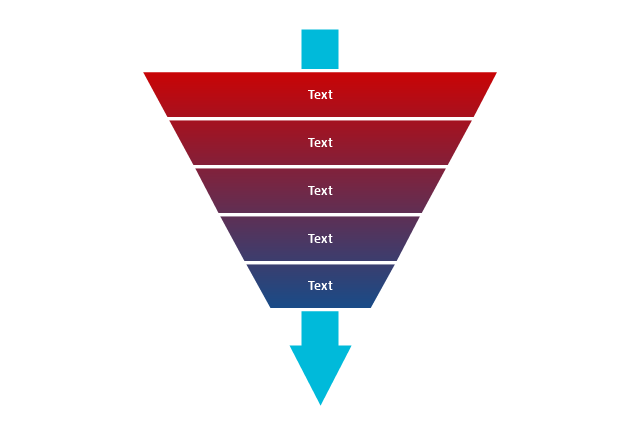
Pyramid Diagram

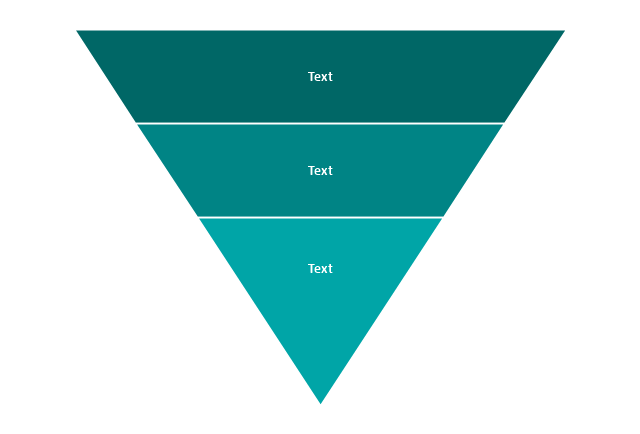
Pyramid Diagram

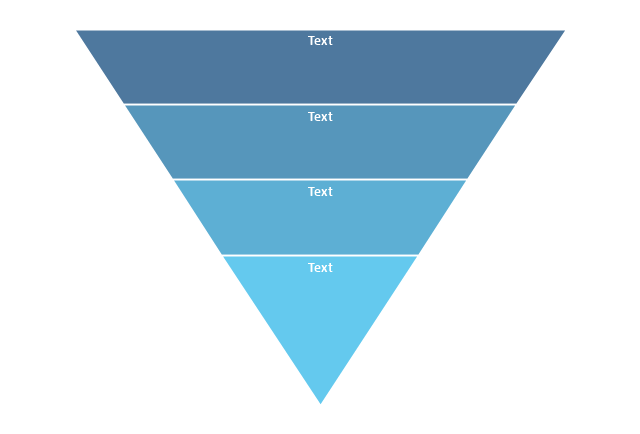
Pyramid Diagram

Pyramid Diagram

The vector stencils library "Pyramid diagrams" contains 28 templates of pyramid diagrams, triangle charts and triangular schemes.
Use these templates to create your pyramid diagrams in the ConceptDraw PRO diagramming and vector drawing software extended with the Pyramid Diagrams solution from the Marketing area of ConceptDraw Solution Park.
Use these templates to create your pyramid diagrams in the ConceptDraw PRO diagramming and vector drawing software extended with the Pyramid Diagrams solution from the Marketing area of ConceptDraw Solution Park.
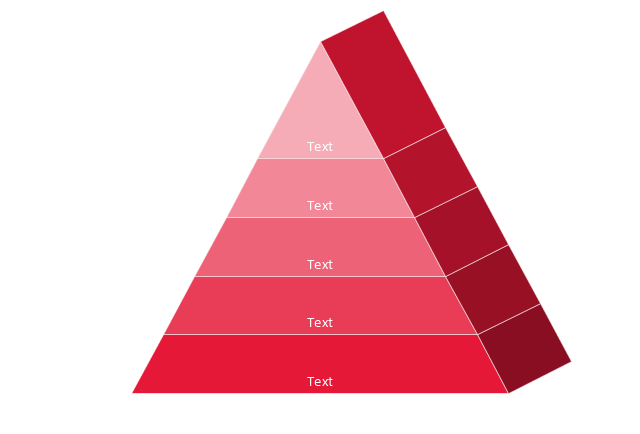
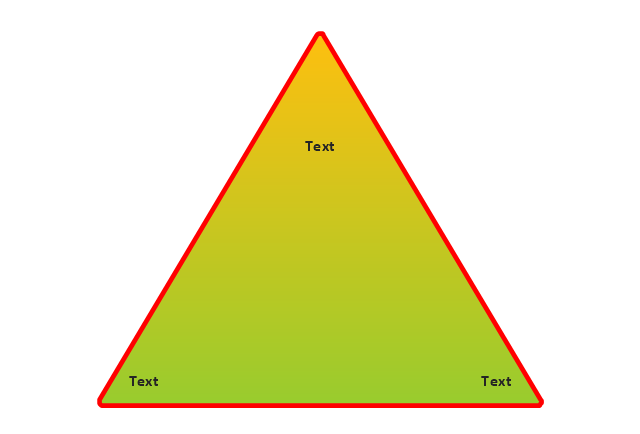
Pyramid 1
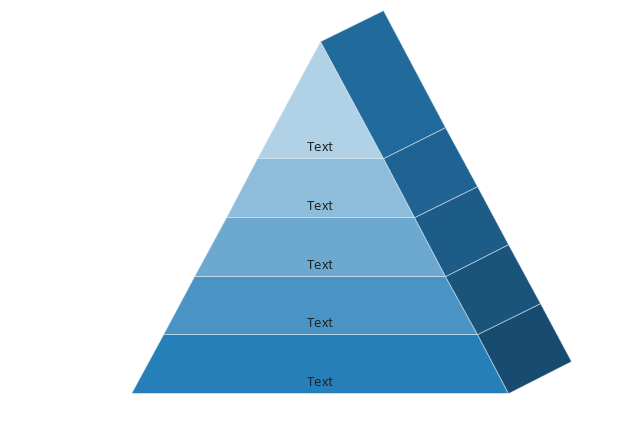
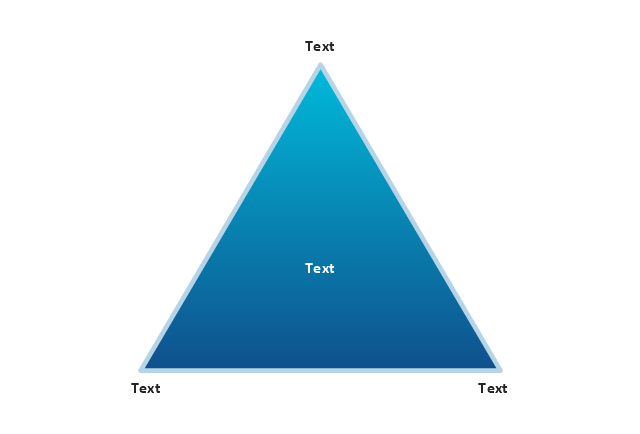
Pyramid 2
Pyramid 3
Pyramid 4
Pyramid 5
Pyramid 1 Isometric
Pyramid 2 Isometric
Pyramid 3 Isometric
Pyramid 4 Isometric
Pyramid 5 Isometric
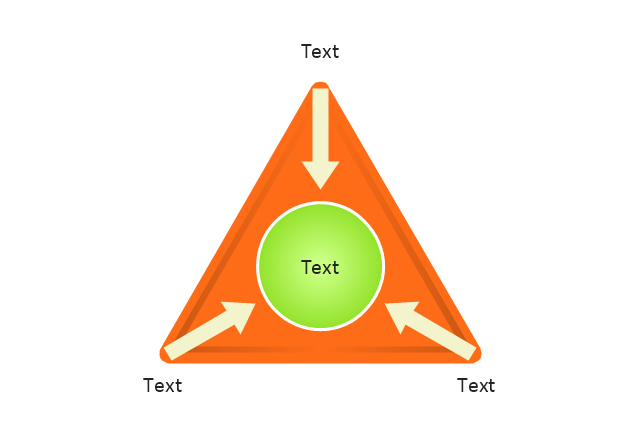
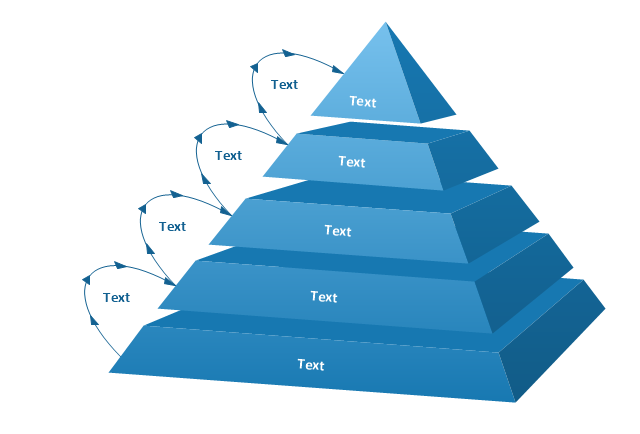
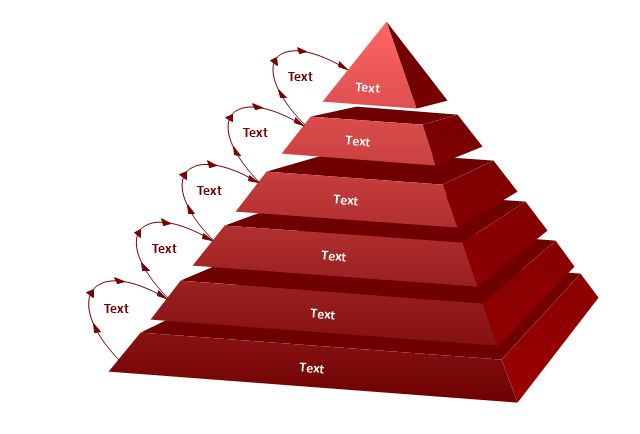
Triangle diagram, arrows
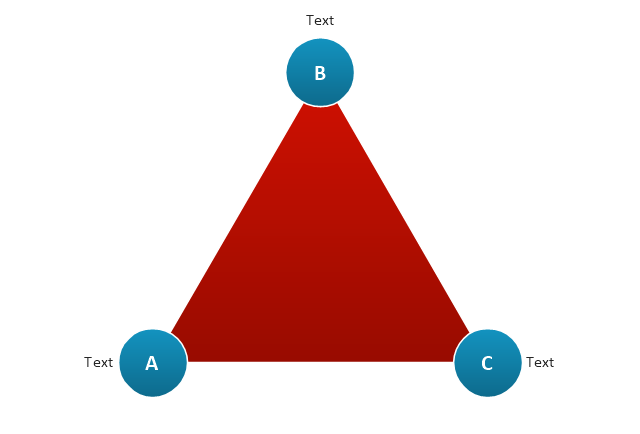
Triangle diagram
Triangular pyramid
Triangular diagram
Triangle scheme
Triangle chart

Triangle chart, isometric
Triangular scheme
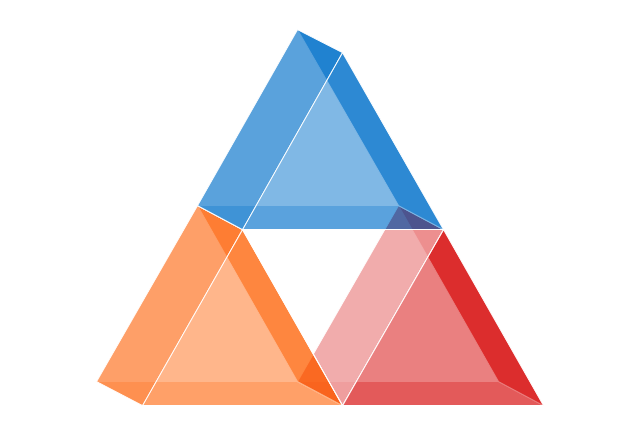
Arrowed block pyramid

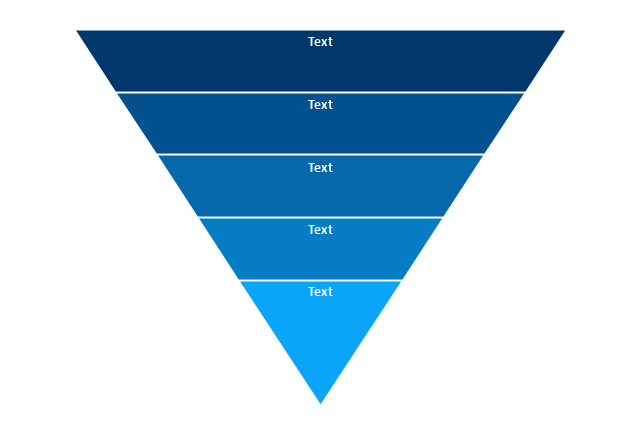
Funnel diagram
3-level funnel diagram
4-level funnel diagram
5-level funnel diagram
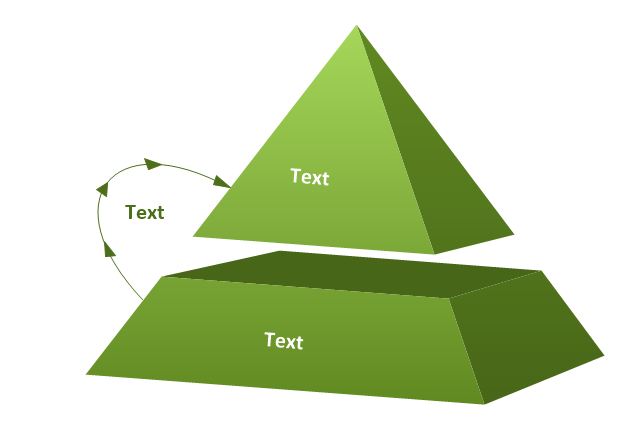
2-level pyramid diagram
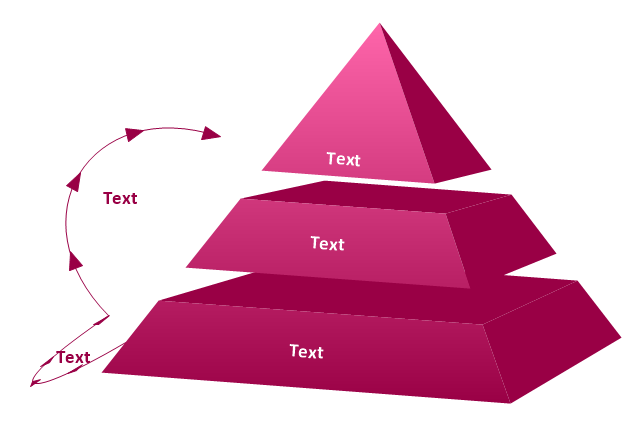
3-level pyramid diagram
4-level pyramid diagram
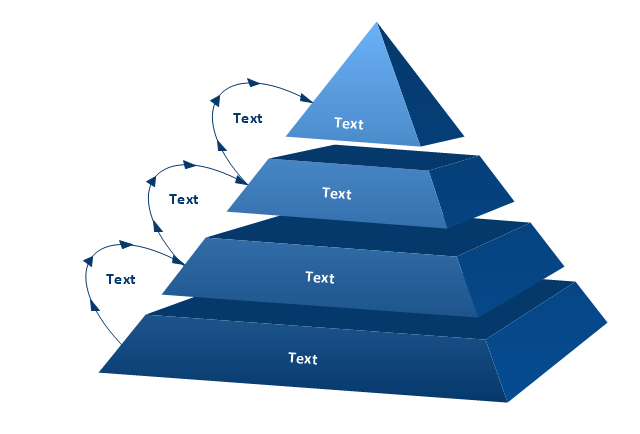
5-level pyramid diagram
6-level pyramid diagram
Pyramid Diagram

Pyramid Chart Examples

Pyramid Charts

 Pyramid Diagrams
Pyramid Diagrams solution extends ConceptDraw DIAGRAM software with templates, samples and library of vector stencils for drawing the marketing pyramid diagrams.
HelpDesk
How to Draw a Pyramid Diagram

Chart Software for Better Presentations

Bar Diagrams for Problem Solving. Create space science bar charts with Bar Graphs Solution

- 4-Set Venn diagram - Template | Pyramid Diagram | Defensive ...
- Venn Diagram | Garrett IA Diagrams with ConceptDraw PRO ...
- Triangular Venn diagram - Template | Pyramid Charts | Pyramid ...
- Knowledge - Venn diagram | Pyramid Diagram | Knowledge ...
- Venn Diagram Examples for Problem Solving. Computer Science ...
- Design elements - Venn diagrams | Pyramid Charts | Bubble ...
- Pyramid Chart Examples | Venn Diagram Examples for Problem ...
- Venn Diagrams | Pyramid Diagram | Best Tool for Infographic ...
- Venn Diagrams | Pyramid Chart Examples | Venn Diagram ...
- Triangle chart - Template | Pyramid Diagram and Pyramid Chart ...
- Pyramid diagrams - Vector stencils library | 4 Oval Venn Diagram
- UML Diagram | Pyramid Diagram | Data structure diagram with ...
- 5-Set Venn diagram - Template | 5 Level pyramid model diagram ...
- Pyramid Diagram | Pyramid Charts | Venn Diagram | Pyramid Of ...
- Pyramid Diagram | Venn Diagram | Pyramid Diagram | What Is ...
- Pyramid Diagram | 3 Circle Venn Diagram . Venn Diagram Example ...
- Venn Diagram | Venn Diagrams | Pyramid Chart Examples ...
- Venn Diagram | Triangular Venn diagram - Template | How to ...
- Venn Diagram Examples for Problem Solving. Computer Science ...