Basic of Flowchart: Meaning and Symbols


UML Flowchart Symbols

"A Guide to the Project Management Body of Knowledge - Fifth Edition provides guidelines for managing individual projects and defines project management related concepts. It also describes the project management life cycle and its related processes, as well as the project life cycle.
The Guide recognizes 47 processes that fall into five basic process groups and ten knowledge areas that are typical of almost all projects.
The five process groups are:
Initiating,
Planning,
Executing,
Monitoring and Controlling,
Closing.
The ten knowledge areas are:
Project Integration Management,
Project Scope Management,
Project Time Management,
Project Cost Management,
Project Quality Management,
Project Human Resource Management,
Project Communications Management,
Project Risk Management,
Project Procurement Management,
Project Stakeholders Management (added in 5th edition).
Each of the ten knowledge areas contains the processes that need to be accomplished within its discipline in order to achieve an effective project management program. Each of these processes also falls into one of the five basic process groups, creating a matrix structure such that every process can be related to one knowledge area and one process group." [A Guide to the Project Management Body of Knowledge. Wikipedia]
The flow chart example "Project management life cycle" was created using the ConceptDraw PRO diagramming and vector drawing software extended with the Flowcharts solution from the area "What is a Diagram" of ConceptDraw Solution Park.
Flowchart - Project management life cycle

Model Based Systems Engineering

3 Circle Venn Diagram. Venn Diagram Example

UML Notation

This double bar chart sample shows the nitrate concentration in milligrams per liter in Community Water Systems (CWS), mean and maximum by year, in New Mexico in 1999-2015. It was drawn using data from the New Mexico's Indicator-Based Information System (NM-IBIS) website. [ibis.health.state.nm.us/ indicator/ complete_ profile/ CommWaterNitrates.html]
"Nitrate toxicity is a preventable cause of methemoglobinemia (blue baby syndrome), especially in infants. Infants younger than 4 months of age are at greatest risk of toxicity from nitrate-contaminated drinking water.
These infants are more susceptible to developing methemoglobinemia because the pH of their gut is normally higher (less acidic) than in older children and adults. The higher pH enhances the conversion of ingested nitrate to the more toxic nitrite. The bacterial flora of a young infant's gut is also different from that found in older children and adults and might be more likely to convert ingested nitrate to nitrite. Gastroenteritis can increase body transformation of nitrate to nitrite and absorption into the bloodstream of nitrite from the large intestine.
A large proportion of hemoglobin in young infants is in the form of fetal hemoglobin. Fetal hemoglobin is more readily oxidized to methemoglobin (MHg) by nitrites than is adult hemoglobin. In addition, in infants, the enzyme (NADH-dependent methemoglobin reductase) responsible for reduction of formed MHg back to normal hemoglobin has only about half the activity it has in adults.
Symptoms such as shortness of breath and bluish skin coloring around the mouth, hands, or feet, can occur in infants rapidly over a period of days. If the condition is severe, it could lead to convulsions, coma, and even death, if untreated. Most older children and adults can take in larger amounts of nitrate without experiencing the same health effects as infants. However, pregnant women, nursing mothers, and people with low stomach acid conditions or those deficient in an enzyme that changes MHg back to normal hemoglobin are more susceptible to nitrate-induced methemoglobinemia and could be affected by water with nitrate levels above 10 mg/ L.
Adverse reproductive outcomes such as spontaneous abortions, intrauterine growth retardation, and various birth defects such as anencephaly have been reported in scientific literature from exposure to high nitrate levels in drinking water; however, the evidence is inconsistent.
Little is known about possible health effects from high nitrate level exposure over a long period of time. However, some studies suggest that there might be a risk of stomach, esophageal or bladder cancers in people with prolonged ingestion of high levels of nitrate. This might be due to the formation of nitrosoamines in the body following ingestion exposure to high levels of nitrate.
International Agency for Research on Cancer (IARC) classified ingested nitrate or nitrite as probably carcinogenic to humans (Group 2A) under conditions that result in formation of nitroso-compounds (e.g., nitrosoamines) in the body (endogenous nitrosation)." [ibis.health.state.nm.us/ indicator/ view/ CommWaterNitrates.MeanMax.Year.html]
The column chart example "Nitrate concentration in Community Water Systems (CWS)" was created using the ConceptDraw PRO diagramming and vector drawing software extended with the Bar Graphs solution from the Graphs and Charts area of ConceptDraw Solution Park.
Double bar graph
.png--diagram-flowchart-example.png)
UML Tool & UML Diagram Examples

Data Modeling with Entity Relationship Diagram

Data Flow Diagram Software

UML Diagram

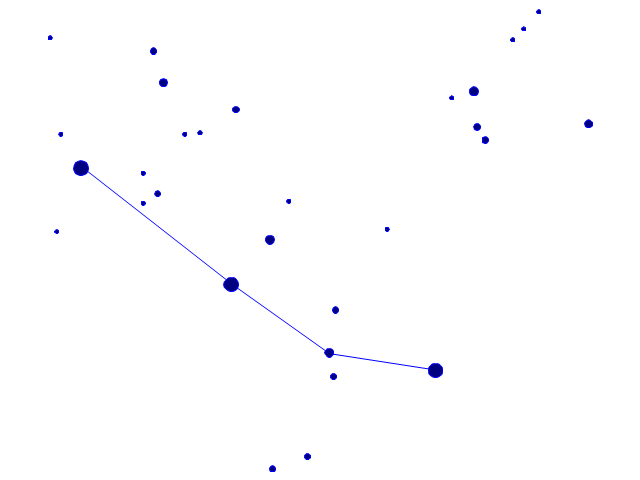
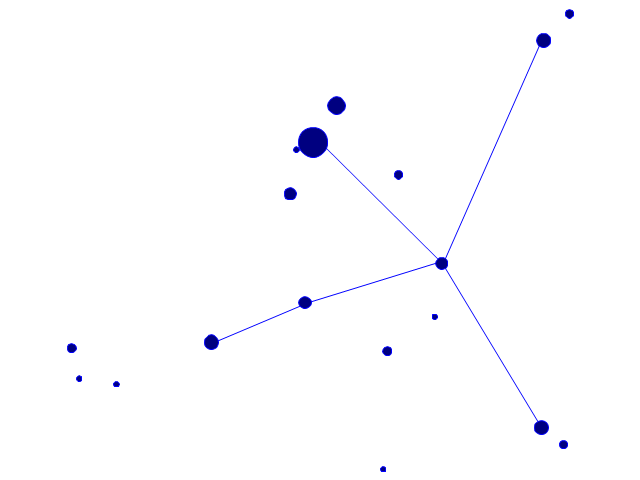
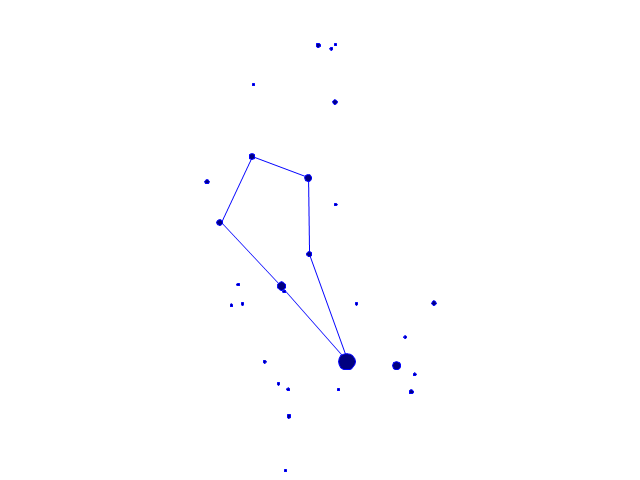
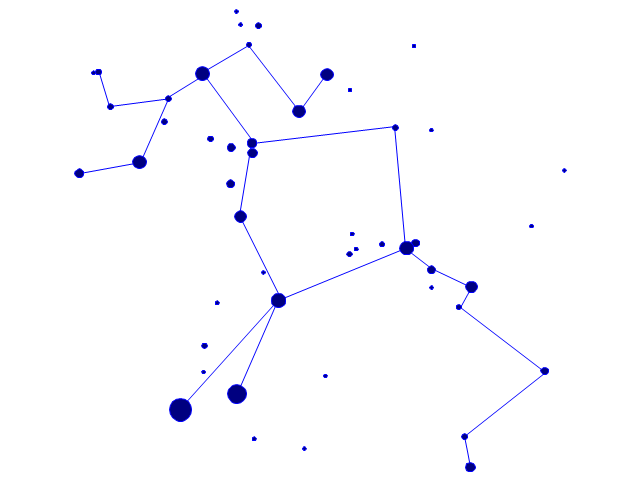
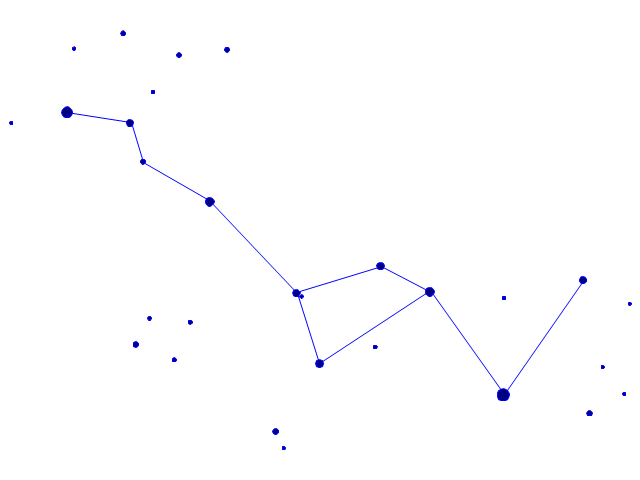
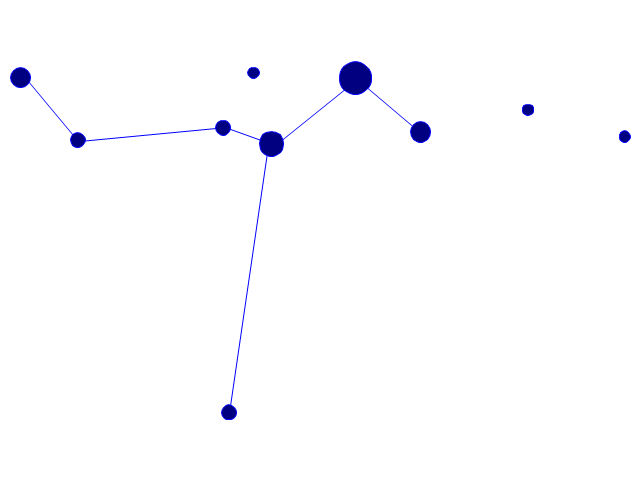
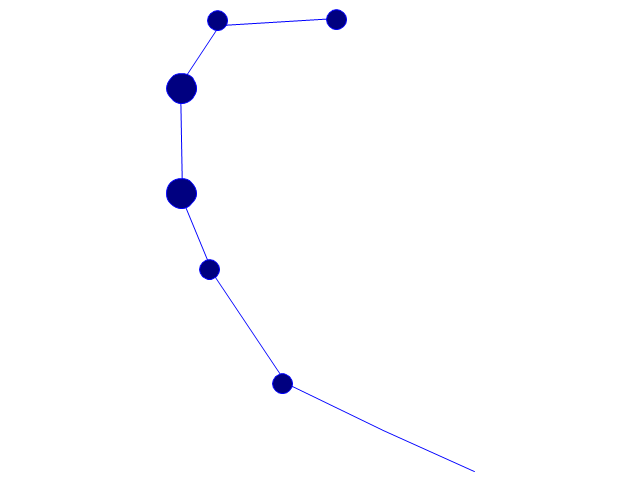
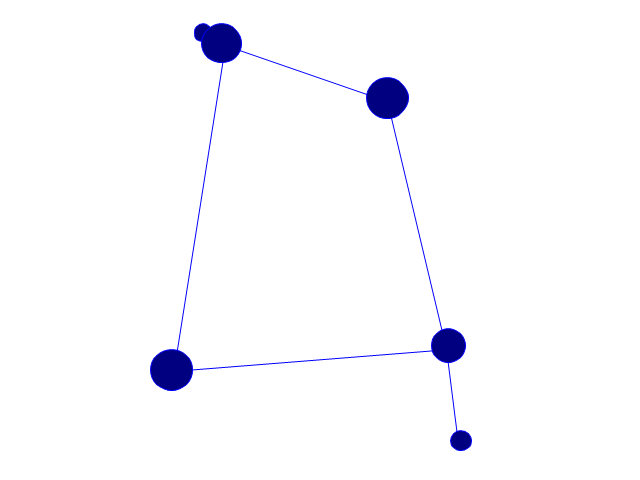
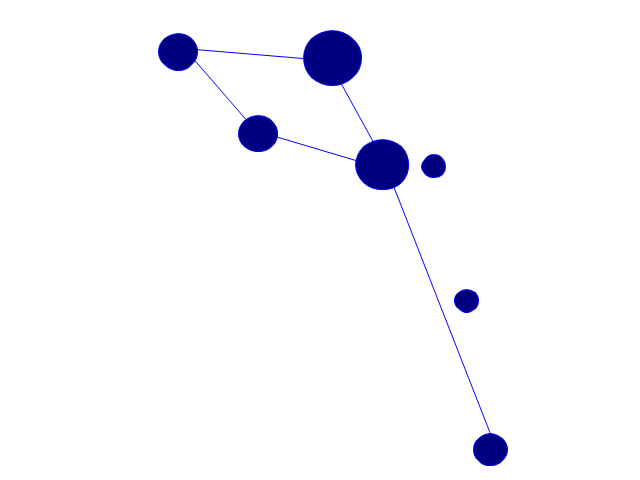
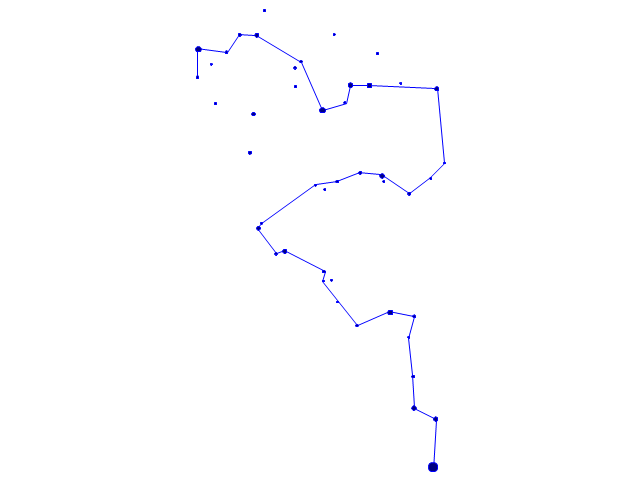
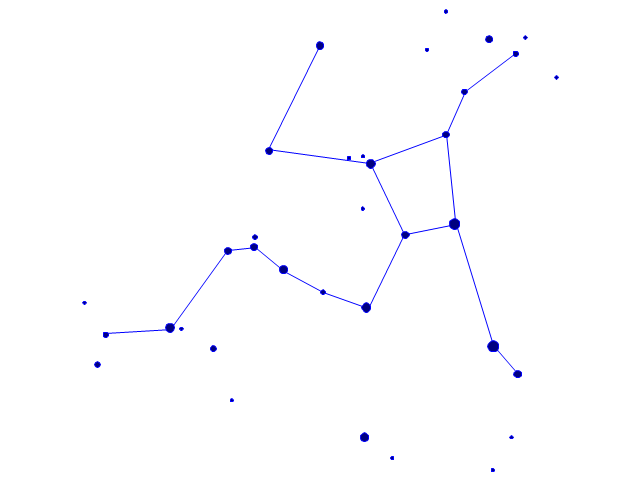
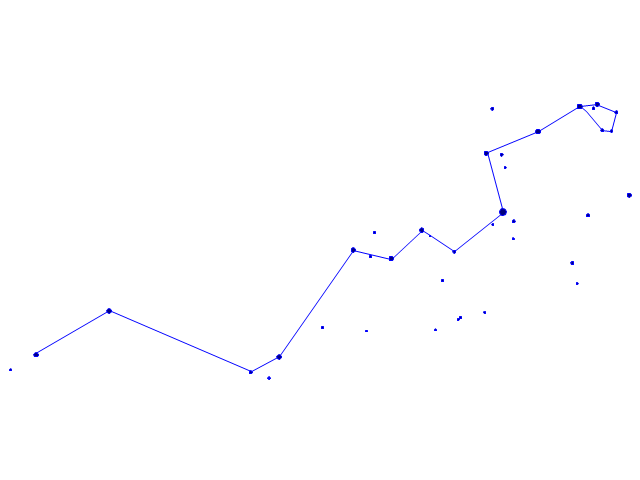
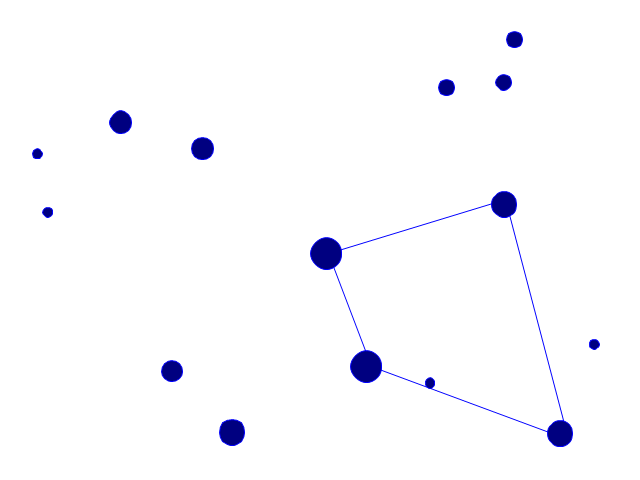
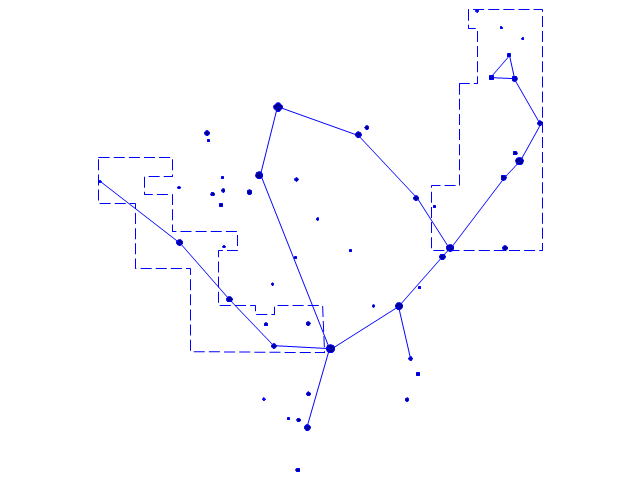
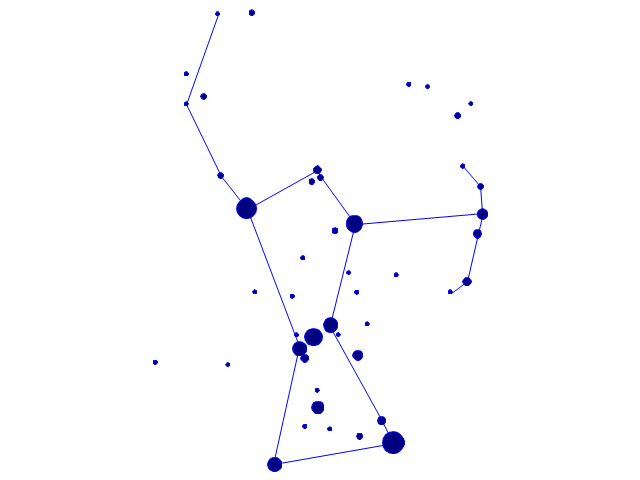
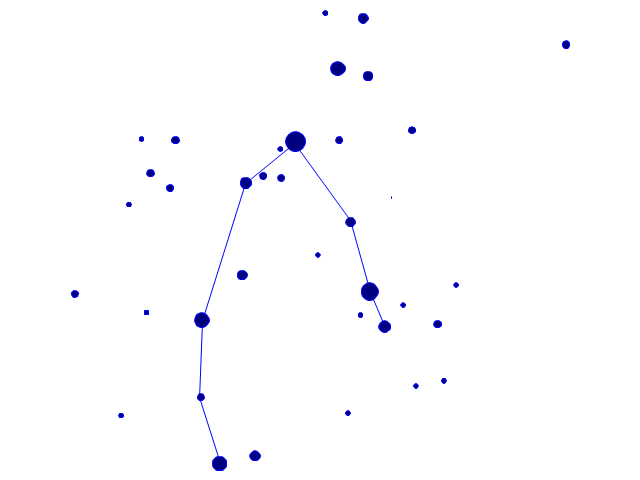
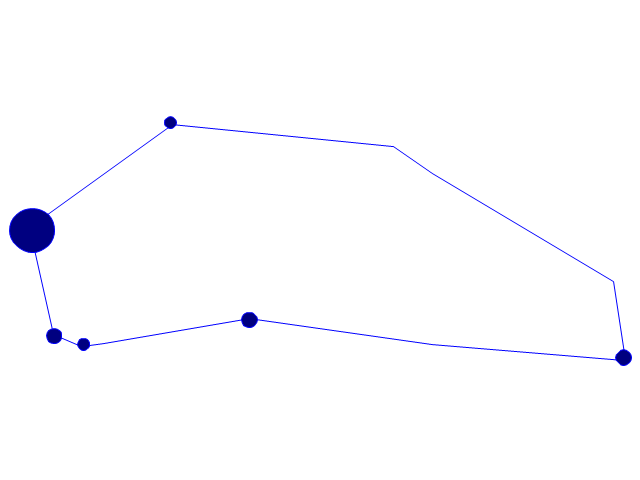
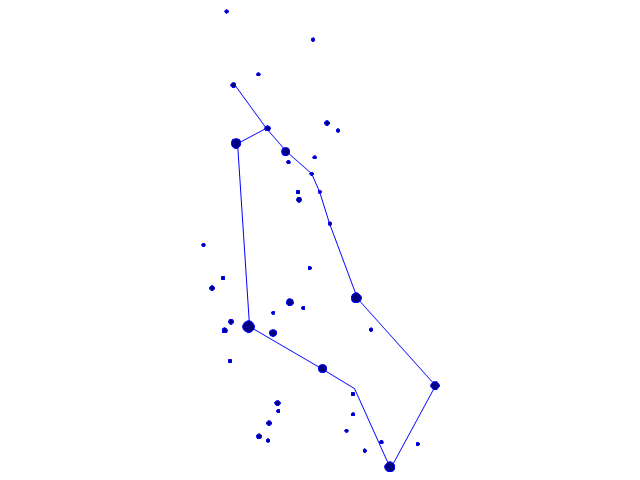
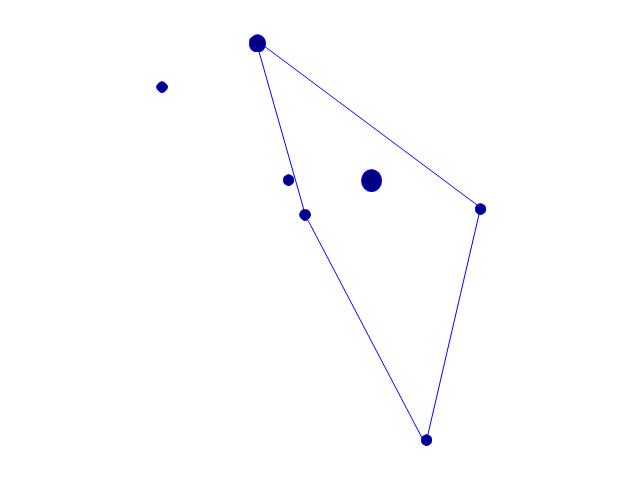
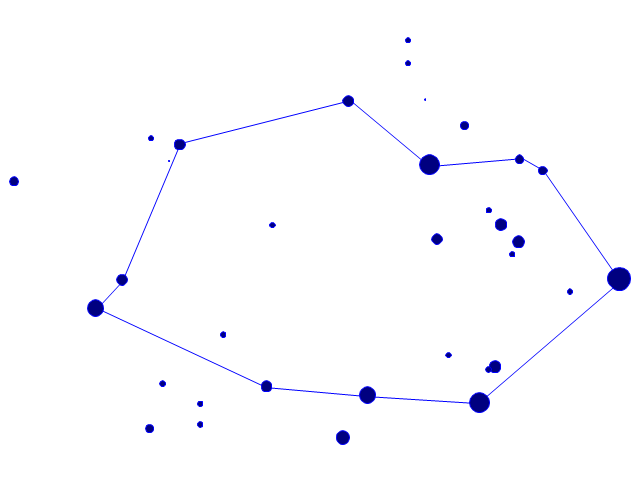
The vector stencils library "Constellations except Zodiac, Northern and Southern" contains 47 star constellation maps of all constellations except Zodiac, Northern (45-90 degrees) and Southern (45-90 degrees).
Use these shapes for drawing astronomical diagrams and illustrations in ConceptDraw PRO diagramming and vector drawing software extended with the Astronomy solution from the Science and Education area in ConceptDraw Solution Park.
Use these shapes for drawing astronomical diagrams and illustrations in ConceptDraw PRO diagramming and vector drawing software extended with the Astronomy solution from the Science and Education area in ConceptDraw Solution Park.
Andromeda
Antlia

Aquila
Auriga

Bootes
Caelum

Canes Venatici

Canis Major

Canis Minor

Centaurus
Cetus
Columba
Coma Berenices

Corona Australis
Corona Borealis

Corvus
Crater

Cygnus

Delphinus
Equuleus

Eridanus
Fornax

Grus

Hercules
Hydra
Lacerta

Leo Minor

Lepus
Lupus
Lynx
Lyra
Microscopium

Monoceros

Ophiuchus and Serpens
Orion
Pegasus

Perseus
Piscis Austrinus
Puppis
Pyxis

Sagitta

Sculptor

Scutum
Sextans

Triangulum
Vela
Vulpecula

Entity-Relationship Diagram (ERD) with ConceptDraw DIAGRAM
 <br>with ConceptDraw DIAGRAM *")

How To Create Onion Diagram

 Rapid UML
Rapid UML solution extends ConceptDraw DIAGRAM software with templates, samples and libraries of vector stencils for quick drawing the UML diagrams using Rapid Draw technology.
Workflow Application

Electrical Symbols — Thermo

Pyramid Diagram and Pyramid Chart

Entity Relationship Diagram Examples

Software Diagram Examples and Templates

- Basic Flowchart Symbols and Meaning | Stakeholder Management ...
- Gantt charts for planning and scheduling projects - Flowchart
- Basic Flowchart Symbols and Meaning | Project management life cycle
- Activity Network (PERT) Chart | Human Anatomy
- Project management life cycle - Flowchart | Process Flowchart ...
- Entity Relationship Diagram Symbols | Dependency Diagram Online
- Line Chart Template for Word | Physics Symbols | Process Flow ...
- Innovation life cycle - Arrow loop diagram | Project management life ...
- Project — Assigning Resources | How To Implement Collaborative ...
- UML Use Case Diagram Example. Registration System