Geo Map — Africa
Africa Map Contours and Continent Overview
Africa is the second-largest continent in the world by both land area and population, after Asia. Its total area is about 30.3 million square kilometers, including adjacent islands.
The continent covers about 6% of the Earth’s total surface area and 20.4% of its total land area. Africa is bordered by the Mediterranean Sea to the north, the Atlantic Ocean to the west, the Indian Ocean to the southeast, and the Red Sea and the Suez Canal to the northeast.
Africa also includes many archipelagos and island territories, including Madagascar in the Indian Ocean.
Africa Population, Languages, and Cultural Diversity
More than 1.2 billion people live in Africa, representing about 16% of the world’s population. The continent is known for its exceptional ethnic, linguistic, and cultural diversity.
There are about 2,000 languages spoken across Africa, including major language families such as Niger-Congo, Nilo-Saharan, Afro-Asiatic, and Khoisan. In addition to African languages, widely used languages on the continent include French, Portuguese, Spanish, Afrikaans, Arabic, Italian, and German in some regions.
African Countries and Regional Context
Most modern African states emerged through the decolonization process of the twentieth century. African nations have also developed regional cooperation through organizations such as the African Union.
These political and regional distinctions are often important when creating Africa political maps, thematic maps, and geospatial infographics.
Africa Economy and Major Countries
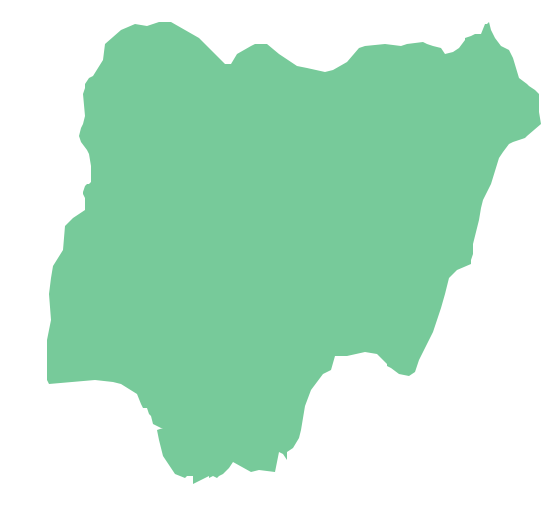
Africa includes several major economies. Nigeria has been one of the continent’s largest economies, followed by South Africa, Egypt, and Algeria.
Economic and regional differences across African countries often make custom maps useful for business, research, and presentation purposes.
Africa Climate, Landscapes, and Natural Features
The climate of Africa ranges from tropical to subarctic depending on the region. Much of northern Africa is desert, while central and southern regions include savannas, jungles, and other distinctive landscapes.
Africa is the hottest continent on Earth, and a large part of its land surface consists of deserts and drylands.
Africa Wildlife and Geographic Interest
Africa is widely known for its wildlife, including lions, hyenas, cheetahs, elephants, giraffes, buffalos, crocodiles, snakes, primates, and many other species.
The continent is especially notable for its large number of megafauna species, which makes it an important region for wildlife, environmental, and tourism-related map design.
Why Create Custom Africa Maps
Whether you are planning travel routes, preparing business materials, or working with location-based information, creating a custom map of Africa can help present countries, cities, geographic areas, and other important details more clearly.
Custom maps are especially useful when you need to focus on specific regions, countries, or themes rather than use a generic ready-made map.
Software for Drawing Africa Map Contours
ConceptDraw DIAGRAM is professional diagramming and vector drawing software that can be used to create maps, schemes, and other visual materials.
With the right tools and libraries, it becomes easier to produce professional-looking maps for business, educational, and presentation use.
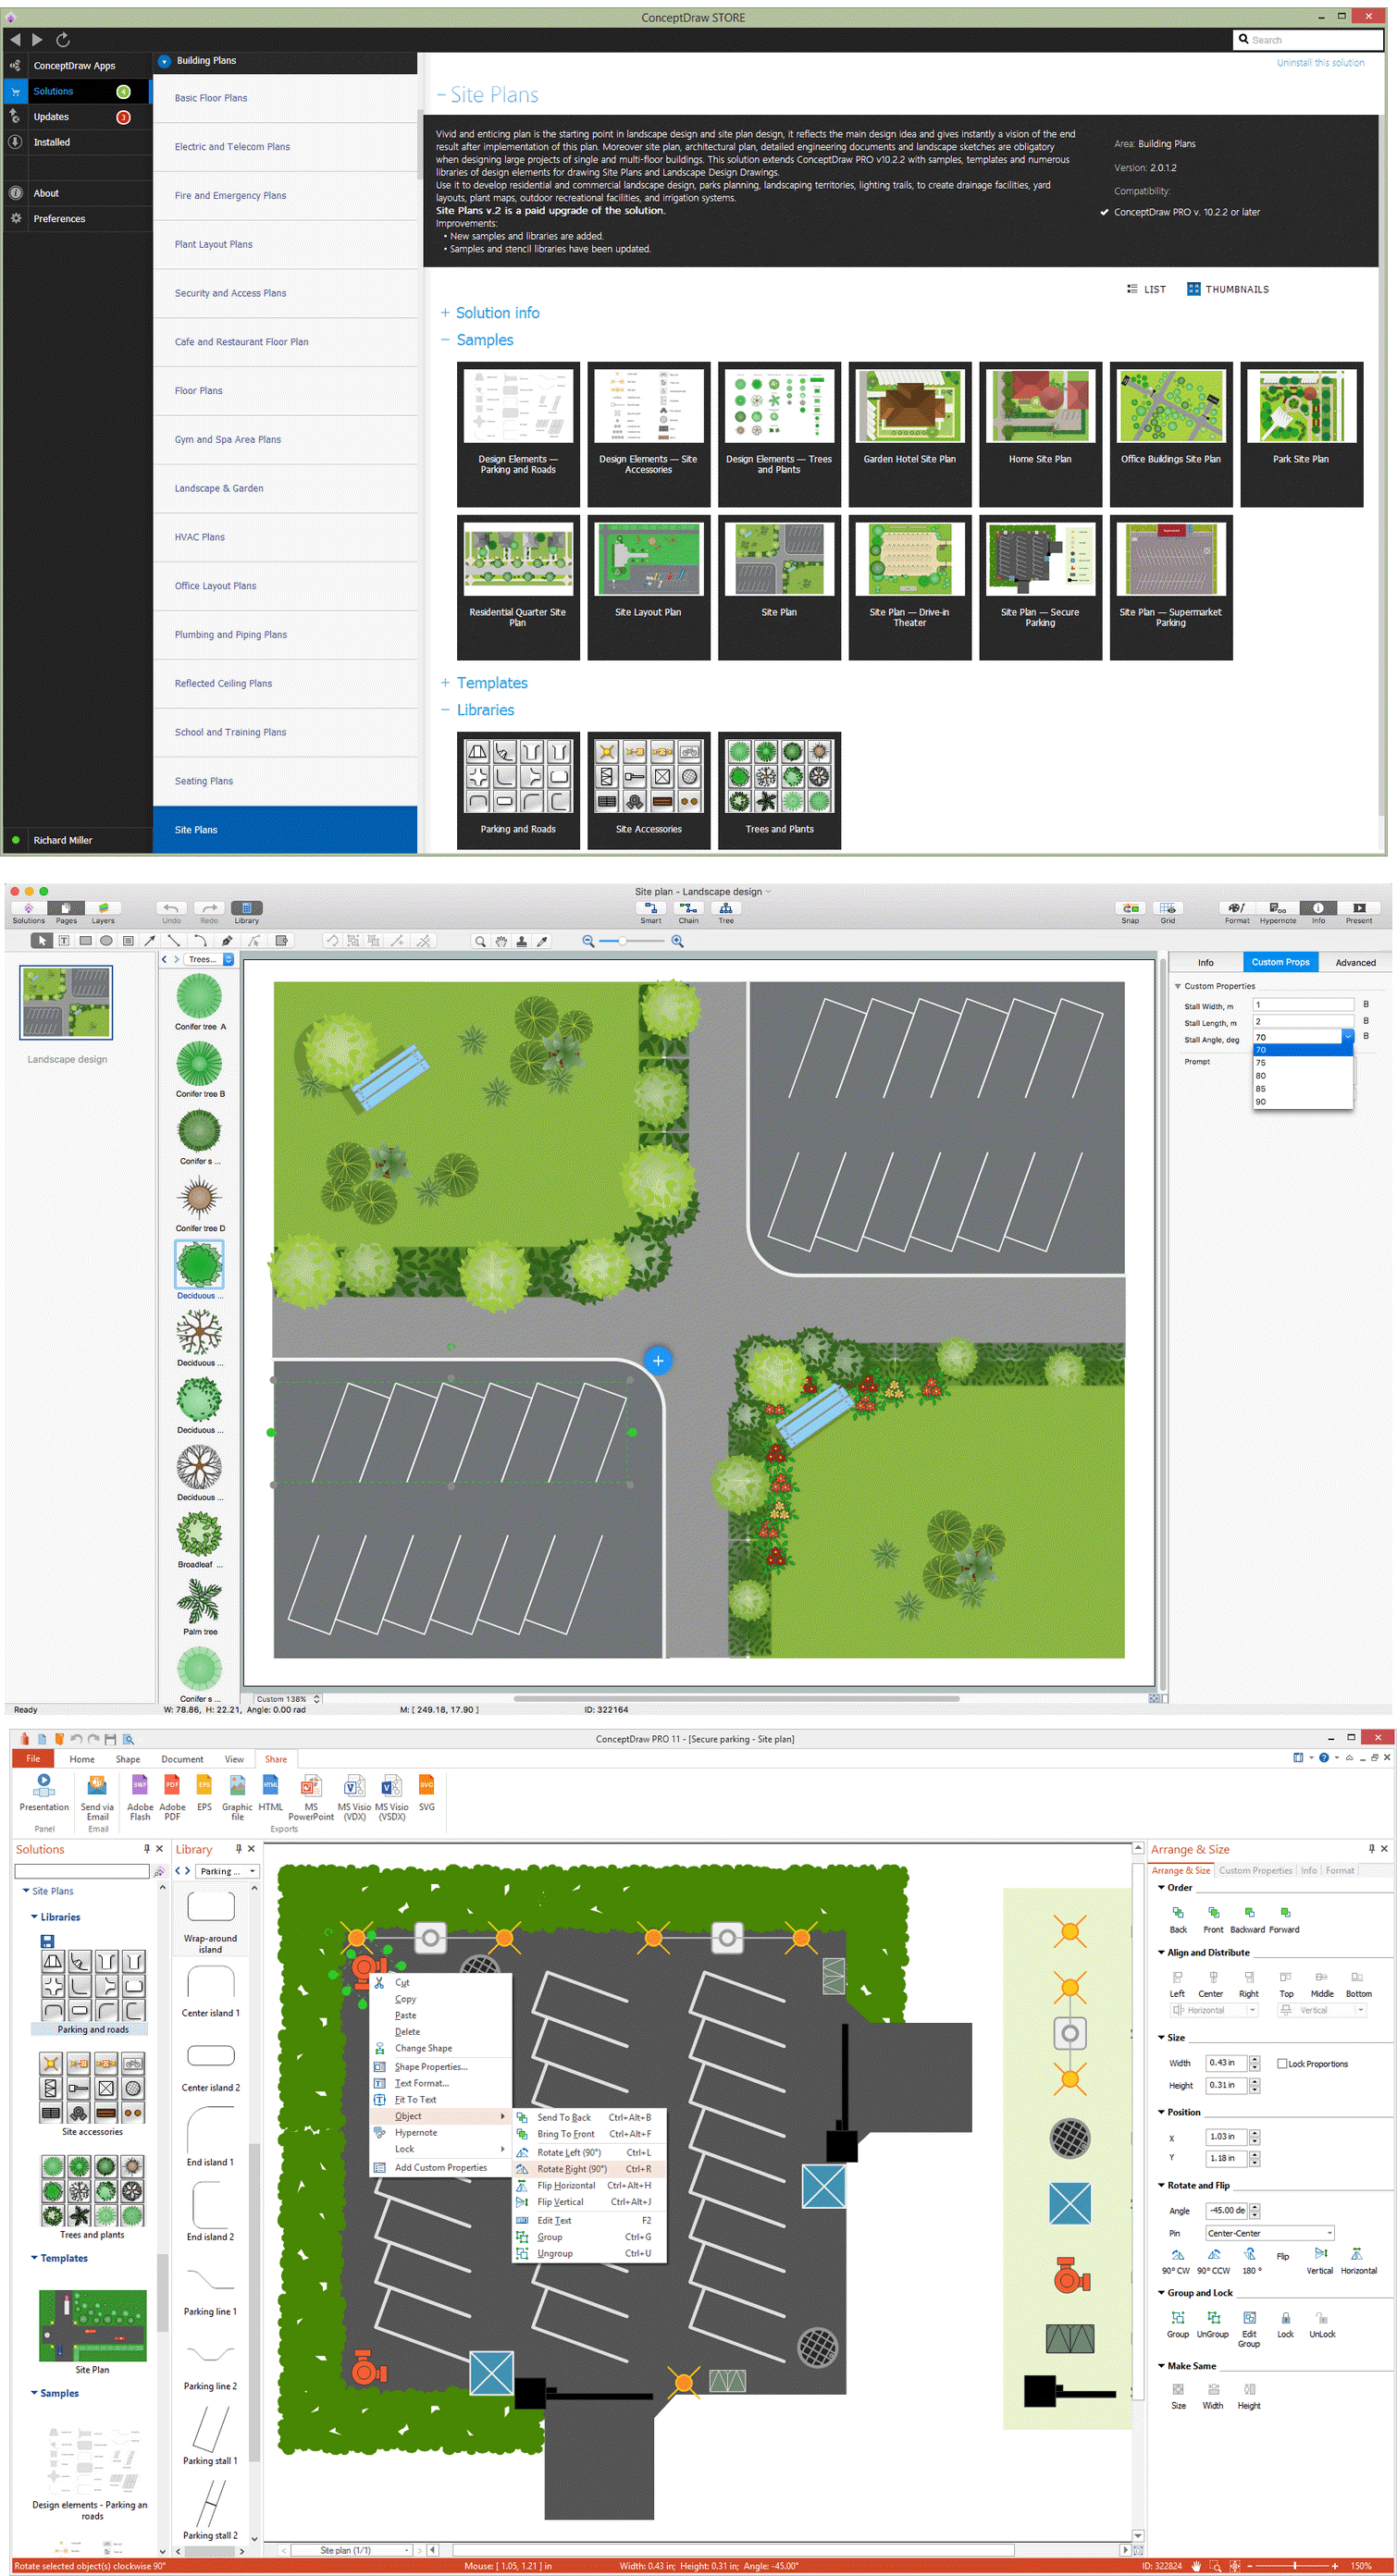
ConceptDraw STORE and Africa Map Solutions
If you use ConceptDraw DIAGRAM together with ConceptDraw STORE, you gain access to solutions, templates, samples, and stencil libraries that simplify the process of creating custom maps.
These resources are especially useful for users who need Africa country contours, thematic maps, and geographic illustrations.
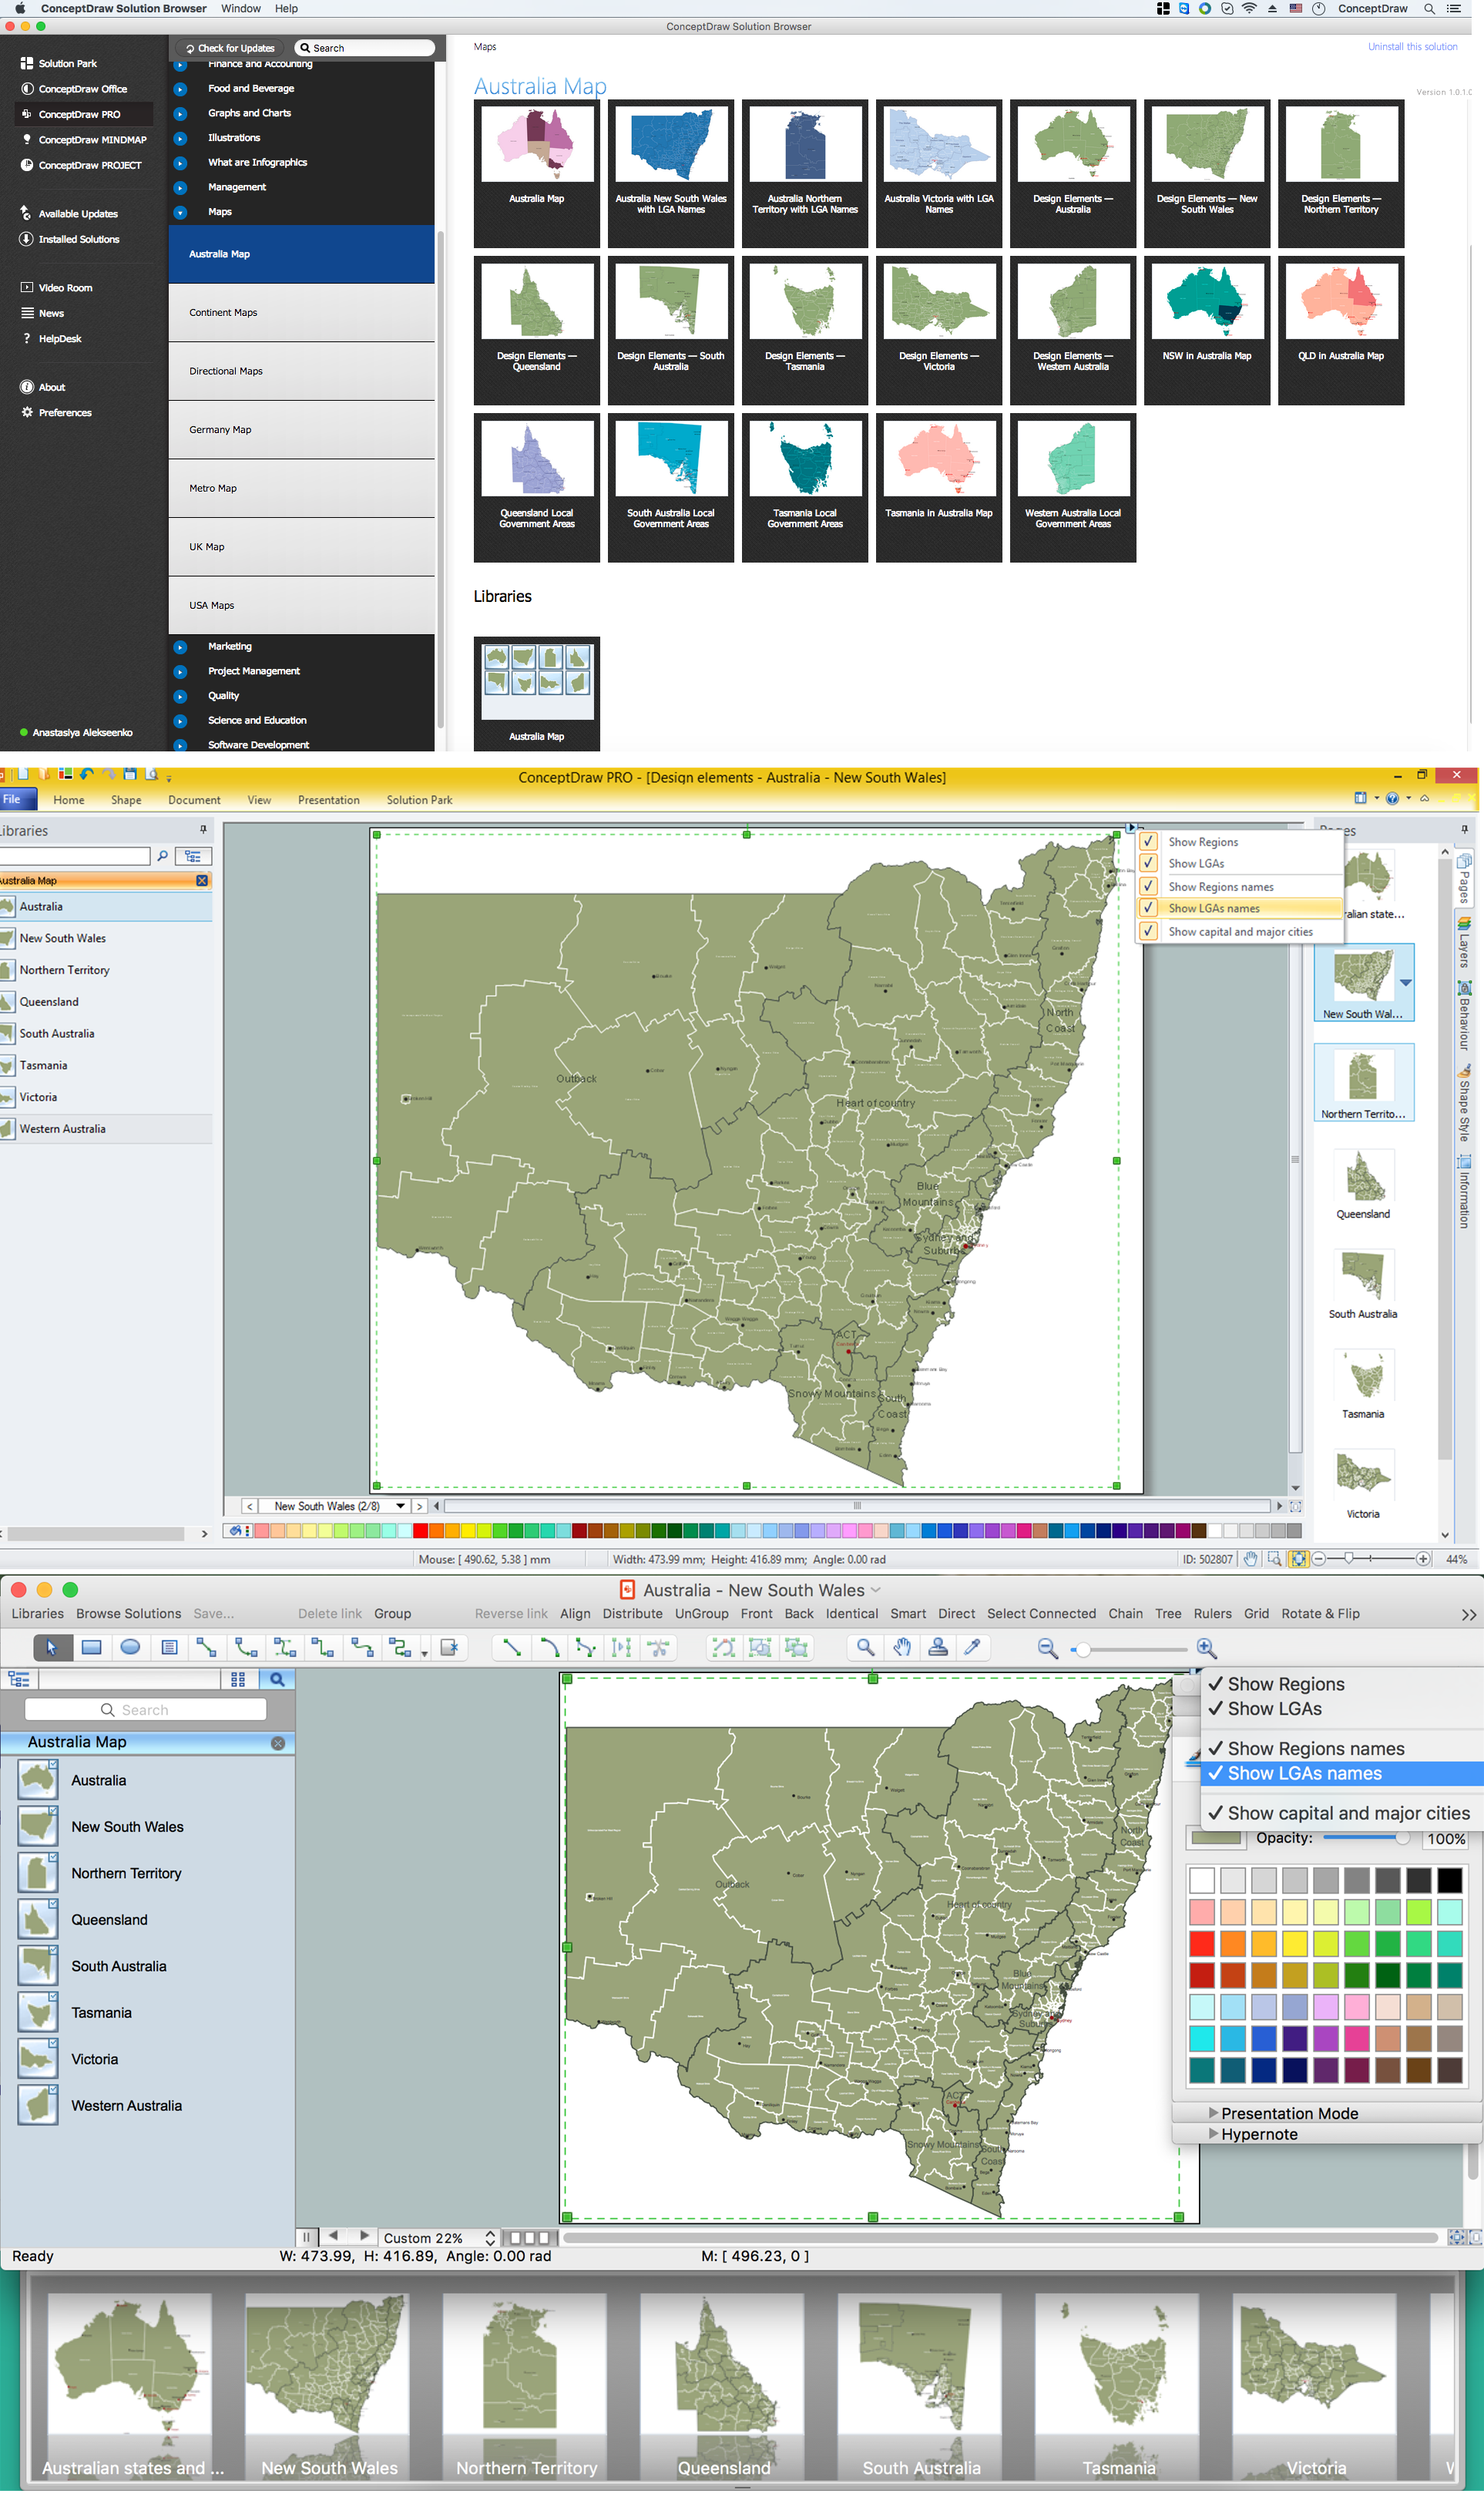
Africa Vector Library and Country Map Contours
The “Africa” vector design elements library, included in the Continent Maps solution, contains country map contours, cartograms, geographic maps, and thematic maps for ConceptDraw DIAGRAM.
These elements help visualize business and thematic information connected with geographic areas, locations, and regional customs.
Where to Find Africa Map Templates
The Continent Maps solution can be downloaded from the Maps area of ConceptDraw Solution Park or accessed through ConceptDraw STORE.
Once installed, it provides useful design resources for creating accurate and visually clear Africa maps.
Continent Maps Solution for Africa

Pic. 1. Continent Maps Solution
Create Africa Thematic Maps and Geospatial Infographics
Use the Africa solution to draw thematic maps, geospatial infographics, and vector illustrations for business documents, presentations, and websites.
These ready-made resources can also help speed up the creation of professional regional and country-level graphics.
Geo Map of Africa
Geo Map — Africa
Africa has a population of over 1.1 billion and an area of 30,370,000 km² (11,730,000 sq mi).
Maps and flowcharts solve different visual tasks. Geographic maps show locations and regions, while flowchart symbols represent steps, decisions, and workflows in business and technical systems.
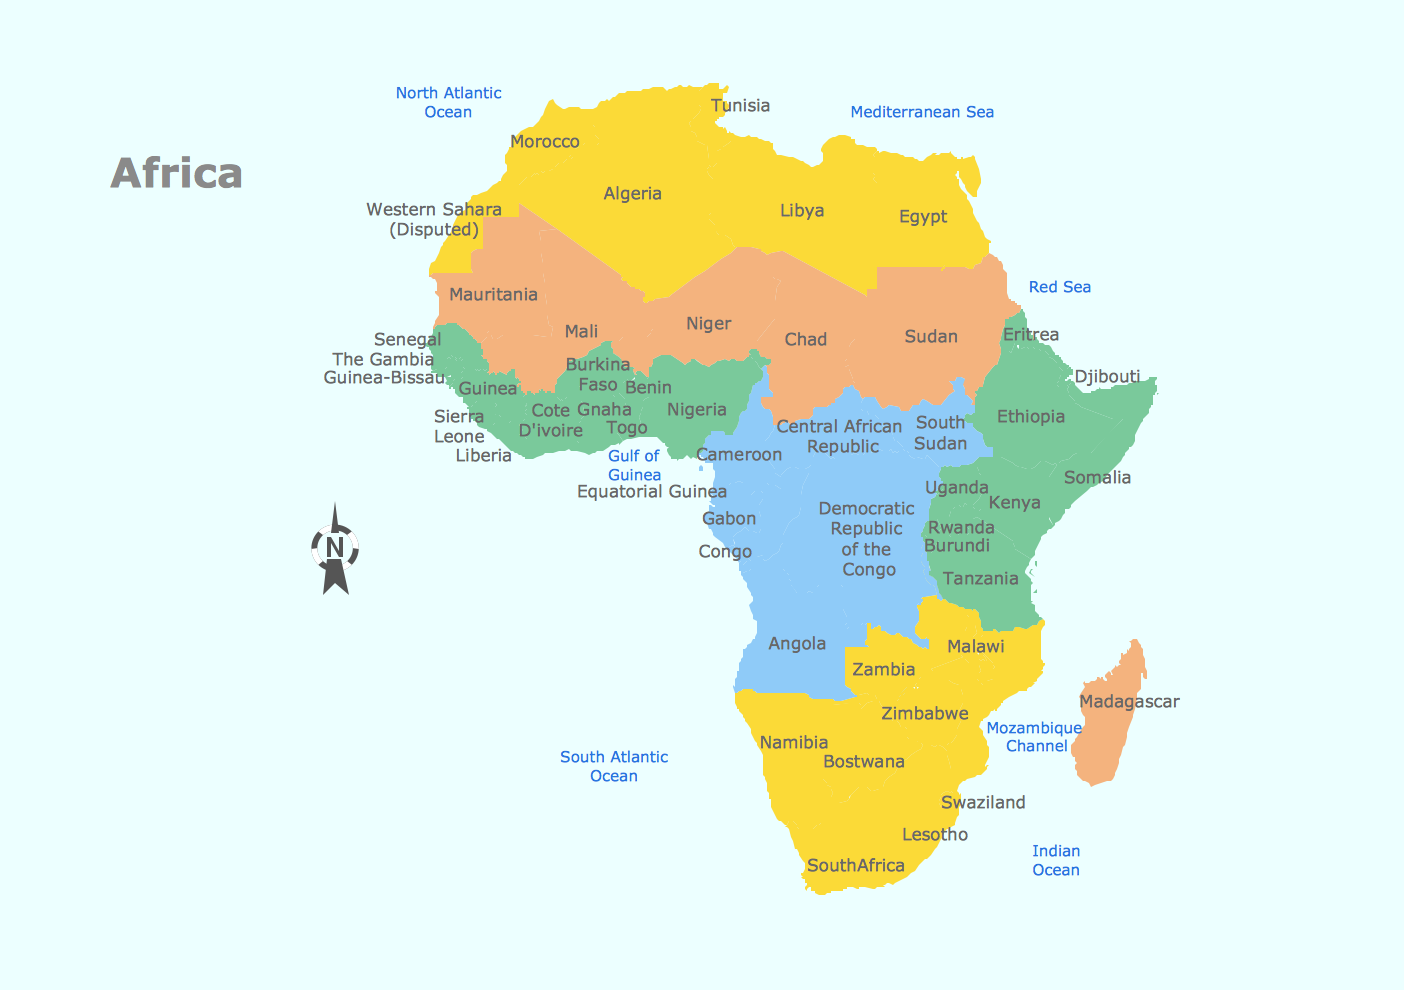
Pic. 2. Africa
Geo Map — Africa Contour
Africa contains 54 (and 2 disputed) counties.
In addition to geographic visualization, ConceptDraw solutions support process modeling, including flowcharts, workflow diagrams, and business process mapping for professional documentation.

Pic. 3. Africa Contour
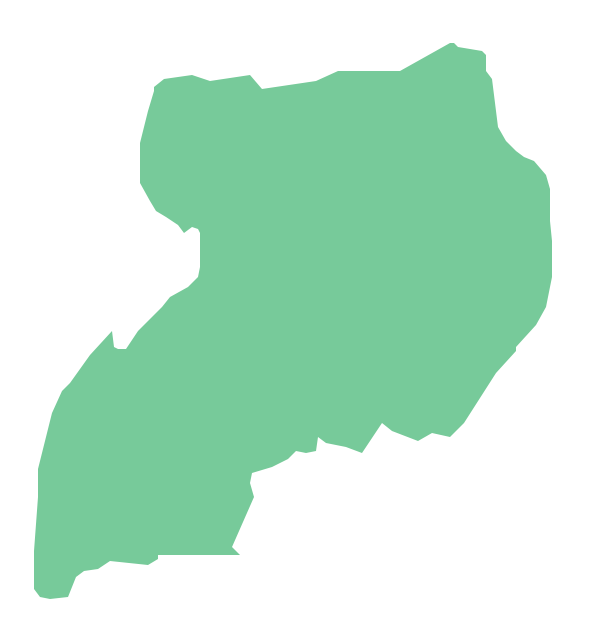
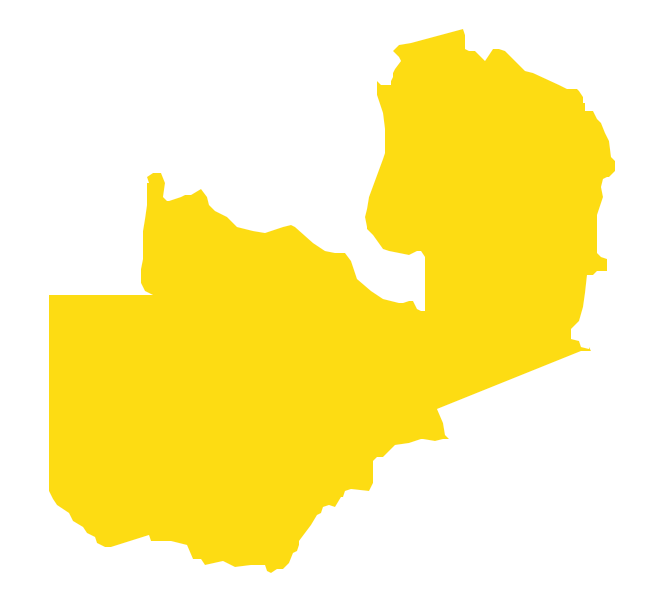
Geo Map — East Africa
East Africa is the easterly region of the African continent, variably defined by geography or geopolitics. 20 territories constitute Eastern Africa: Tanzania, Kenya, Uganda, Rwanda and Burundi, Djibouti, Eritrea, Ethiopia and Somalia, Comoros, Mauritius and Seychelles, Réunion and Mayotte, Mozambique and Madagascar, Malawi, Zambia and Zimbabwe.

Pic. 4. East Africa
Geo Map — West Africa
West Africa has been defined as including the 18 countries Benin, Burkina Faso, the island of Cape Verde, Gambia, Ghana, Guinea, Guinea-Bissau, Ivory Coast, Liberia, Mali, Mauritania, Niger, Nigeria, the island of Saint Helena, Senegal, Sierra Leone, Sao Tome and Principe and Togo.

Pic. 5. West Africa
Geo Map — program library elements of Africa
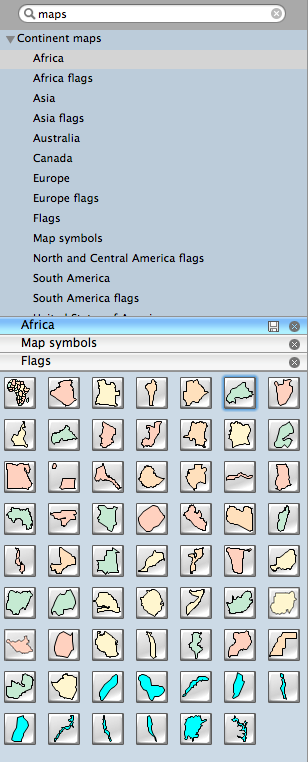
Pic. 6. Program library elements of Africa
Geo Map — elements of Africa flags

Pic. 7. Elements of Africa flags
Geo Map — elements of Africa
This is a list of sovereign states and dependent territories in Africa. It includes both fully recognized states, states with limited recognition, and dependent territories of both African and non-African states. It lists 54 sovereign states and 10 non-sovereign territories.
- Algeria
- Angola
- Benin
- Botswana
- Burkina Faso
- Burundi
- Central African Republic
- Cameroon
- Chad
- Congo
- Congo DRC
- Cote d'Ivoire
- Djibouti
- Egypt
- Equatorial Guinea
- Eritrea
- Ethiopia
- Gabon
- Gambia
- Ghana
- Guinea
- Guinea Bissau
- Kenya
- Lesotho
- Liberia
- Libya
- Madagascar
- Malawi
- Mali
- Mauritania
- Morocco
- Mozambique
- Namibia
- Niger
- Nigeria
- Rwanda
- Senegal
- Sierra Leone
- Somalia
- Swaziland
- Tanzania
- Togo
- Tunisia
- Uganda
- Zambia
- Zimbabwe
- South Africa
- Sudan
- South Sudan
- Western Sahara
- Cape Verde
- Comoros
- Mauritius
- Reunion (France)
- São Tomé and Príncipe
Use the map contours library "Africa" to design thematic maps using the ConceptDraw DIAGRAM diagramming and vector drawing software.
The vector stencils library "Africa" contains 62 map contours: Africa political map, map contours of countries.

Pic. 8. Elements of Africa
Geo Map — Map of the African Union with suspended states
The member states of the African Union are the 54 sovereign states that have ratified or acceded to the Constitutive Act of the African Union to become member states to the African Union (AU). The AU replaced the Organisation of African Unity (OAU), and AU membership was open to all OAU member states. From an original membership of 36 states when the OAU was established on 25 May 1963, there have been eighteen successive enlargements – the largest occurring on 18 July 1975 when four states joined. South Sudan is the newest member state, having joined on 27 July 2011. The only African United Nations member state which could join, or more precisely re-activate its membership, is Morocco, which withdrew following the organization's acceptance of the Sahrawi Arab Democratic Republic, whose status is disputed, as a member state. Spain, primarily a European country, maintains sovereignty over Spanish North Africa and the Canary Islands off the coast, but is only accredited to the African Union.
The African Union is composed of fifty two republics and two kingdoms. The total population of the AU is 1,068,444,000 (2013)
This example is created using ConceptDraw DIAGRAM diagramming software enhanced with Continent Maps solution from ConceptDraw Solution Park.

Pic. 9. African Union with suspended states
All ConceptDraw DIAGRAM documents are vector graphic files and are available for reviewing, modifying, and converting to a variety of formats: image, HTML, PDF file, MS PowerPoint Presentation, Adobe Flash, MS Visio (.VDX, .VSDX).