 Basic Scatter Diagrams
This solution extends ConceptDraw DIAGRAM (or later) with templates, samples and a library of vector stencils for drawing Scatter Diagrams.
HelpDesk
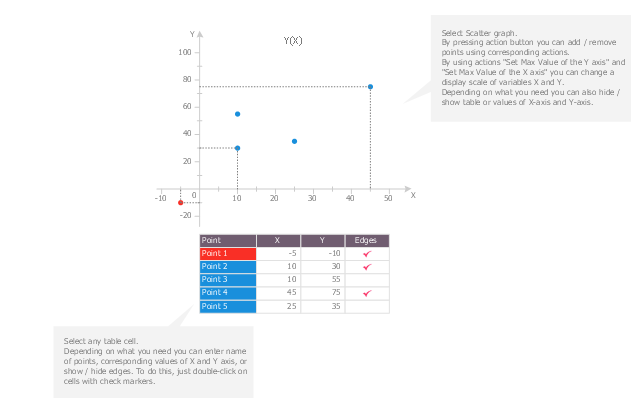
How to Draw a Scatter Diagram

 Scatter Diagrams
The Scatter Diagrams solution extends ConceptDraw DIAGRAM functionality with templates, samples, and a library of vector stencils that make construction of a Scatter Plot easy. The Scatter Chart Solution makes it easy to design attractive Scatter Diagrams used in various fields of science, work, and life activities. ConceptDraw DIAGRAM lets you enter the data to the table and construct the Scatter Plot Graph automatically according to these data.
Scatter Graph Charting Software

Scatter Graph

Scatter Plot Graph

The vector stencils library "Scatter graphs" contains 7 templates of scatter diagrams (scattergraphs, scatter charts, scatter plots, scatterplots, scatter diagrams) for visual analysis of correlation between two variables.
Use these shapes to draw your scatterplots in the ConceptDraw PRO diagramming and vector drawing software.
The vector stencils library "Scatter graphs" is included in the Scatter Diagrams solution of the Graphs and Charts area in ConceptDraw Solution Park.
Use these shapes to draw your scatterplots in the ConceptDraw PRO diagramming and vector drawing software.
The vector stencils library "Scatter graphs" is included in the Scatter Diagrams solution of the Graphs and Charts area in ConceptDraw Solution Park.
Scatter graph 1
Scatter graph 2
Scatter graph 3
Scatter graph 4
Scatter graph 5
Scatter graph 6
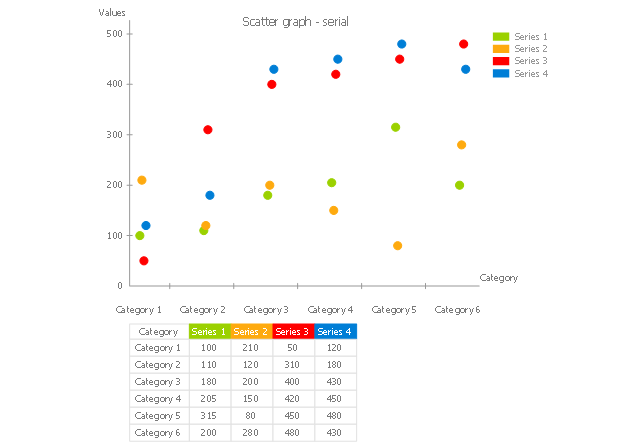
Scatter graph - serial
Scatter Plot

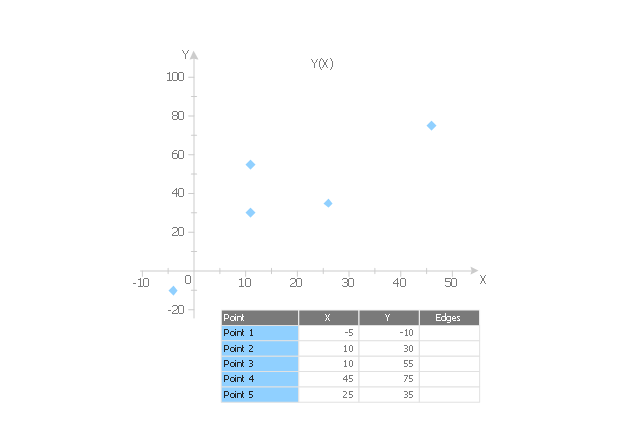
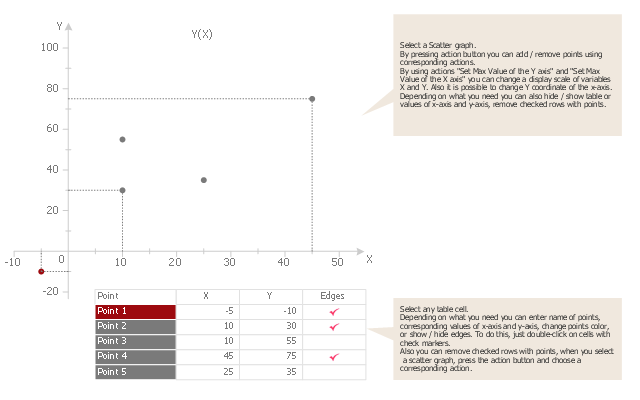
Use this scatter plot template to show values for two variables for your data series in ConceptDraw PRO diagramming and vector drawing software.
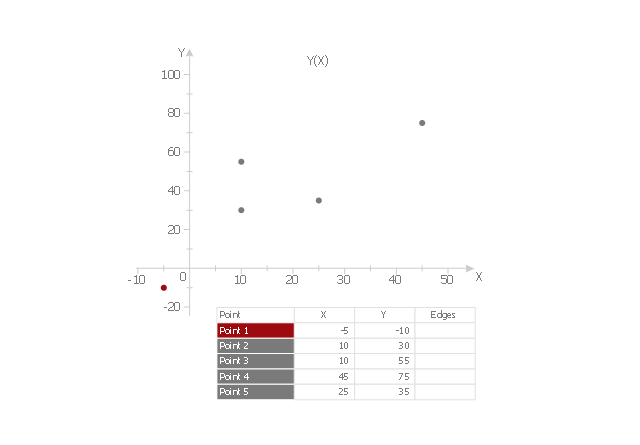
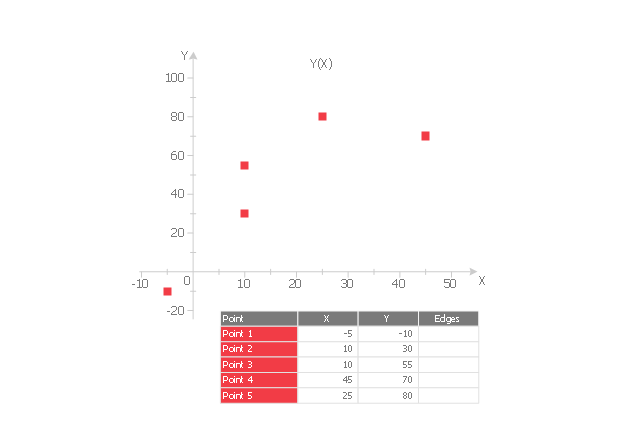
"A scatter plot, scatterplot, or scattergraph is a type of mathematical diagram using Cartesian coordinates to display values for two variables for a set of data.
The data is displayed as a collection of points, each having the value of one variable determining the position on the horizontal axis and the value of the other variable determining the position on the vertical axis. This kind of plot is also called a scatter chart, scattergram, scatter diagram, or scatter graph." [Scatter plot. Wikipedia]
The chart template "Scatter graph" is included in the Basic Scatter Diagrams solution from the Graphs and Charts area of ConceptDraw Solution Park.
Template
Make a Scatter Plot

Blank Scatter Plot

Scatter Diagram

Using the ready-to-use objects from the Line Graphs Solution for ConceptDraw DIAGRAM you can create your own professional looking Scatter Charts quick and easy.
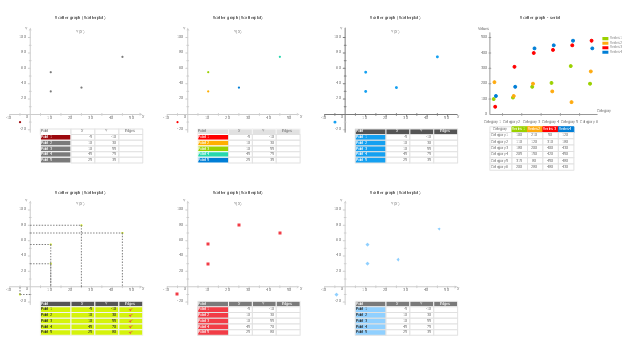
This vector stencils library contains 7 templates of scatter graphs (scattergraphs, scatter charts, scatter plots, scatterplots, scatter diagrams). Use it to design your scatter graphs with ConceptDraw PRO diagramming and vector drawing software for visual analysis of correlation or dependence between two variables.
"In statistics, dependence is any statistical relationship between two random variables or two sets of data. Correlation refers to any of a broad class of statistical relationships involving dependence.
Familiar examples of dependent phenomena include the correlation between the physical statures of parents and their offspring, and the correlation between the demand for a product and its price. Correlations are useful because they can indicate a predictive relationship that can be exploited in practice. For example, an electrical utility may produce less power on a mild day based on the correlation between electricity demand and weather. In this example there is a causal relationship, because extreme weather causes people to use more electricity for heating or cooling; however, statistical dependence is not sufficient to demonstrate the presence of such a causal relationship (i.e., correlation does not imply causation).
Formally, dependence refers to any situation in which random variables do not satisfy a mathematical condition of probabilistic independence. In loose usage, correlation can refer to any departure of two or more random variables from independence, but technically it refers to any of several more specialized types of relationship between mean values." [Correlation and dependence. Wikipedia]
The chart templates example "Design elements - Scatter graphs" is included in the Scatter Diagrams solution from the Graphs and Charts area of ConceptDraw Solution Park.
Templates
The vector stencils library Correlation charts from the Corellation Dashboard solution contains 4 templates of scatter plots for drawing the visual dashboards using the ConceptDraw PRO diagramming and vector drawing software.
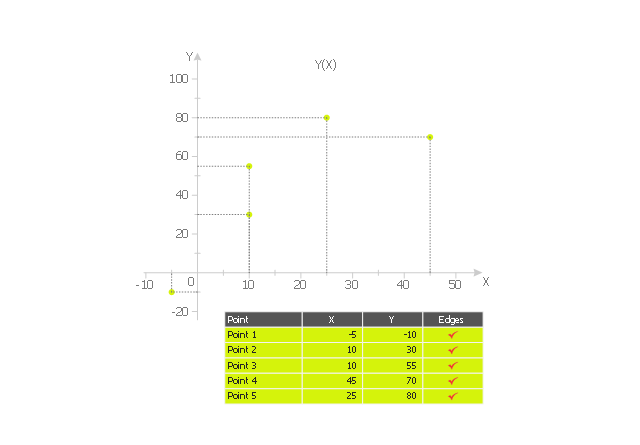
"A scatter plot, scatterplot, or scattergraph is a type of mathematical diagram using Cartesian coordinates to display values for two variables for a set of data.
The data is displayed as a collection of points, each having the value of one variable determining the position on the horizontal axis and the value of the other variable determining the position on the vertical axis. This kind of plot is also called a scatter chart, scattergram, scatter diagram, or scatter graph." [Scatter plot. Wikipedia]
The example "Design elements - Correlation charts" is included in the Corellation Dashboard solution from the area "What is a Dashboard" of ConceptDraw Solution Park.
Scatter graphs

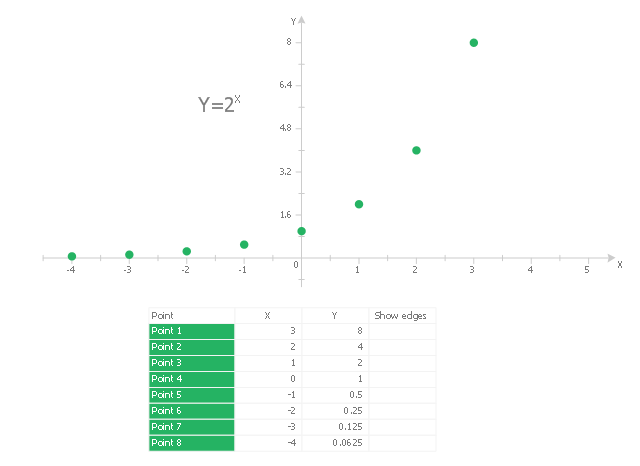
This scatter graph (scattergraph. scatter chart, scatter plot, scatterplot, scatter diagram) example visualizes exponent function.
"Exponentiation is a mathematical operation, written as bn, involving two numbers, the base b and the exponent (or power) n. When n is a positive integer, exponentiation corresponds to repeated multiplication; in other words, a product of n factors, each of which is equal to b (the product itself can also be called power)...
Exponentiation is used pervasively in many other fields, including economics, biology, chemistry, physics, as well as computer science, with applications such as compound interest, population growth, chemical reaction kinetics, wave behavior, and public-key cryptography. ...
Graphs of y = bx... Each curve passes through the point (0, 1) because any nonzero number raised to the power of 0 is 1. At x = 1, the value of y equals the base because any number raised to the power of 1 is the number itself." [Wikipedia. Exponentiation]
The scatter graph example "2^x Function" was created using the ConceptDraw PRO diagramming and vector drawing software extended with the Scatter Diagrams solution from the Graphs and Charts area of ConceptDraw Solution Park.
Scatter chart
This scatter graphs (scattergraph. scatter chart, scatter plot, scatterplot, scatter diagram) sample show how the scatter plot with missing categories on the left,
the growth appears to be more linear with less variation. It was designed on the base of the Wikimedia Commons files: Scatter Plot with missing categories.svg [commons.wikimedia.org/ wiki/ File:Scatter_ Plot_ with_ missing_ categories.svg], and A scatter plot without missing categories.svg [commons.wikimedia.org/ wiki/ File:A_ scatter_ plot_ without_ missing_ categories.svg].
This file is available under the Creative Commons CC0 1.0 Universal Public Domain Dedication. [creativecommons.org/ publicdomain/ zero/ 1.0/ deed.en]
"In statistics, a misleading graph, also known as a distorted graph, is a graph that misrepresents data, constituting a misuse of statistics and with the result that an incorrect conclusion may be derived from it.
Graphs may be misleading through being excessively complex or poorly constructed. Even when constructed to accurately display the characteristics of their data, graphs can be subject to different interpretation. ...
Graphs created with omitted data remove information from which to base a conclusion. ...
In financial reports, negative returns or data that do not correlate a positive outlook may be excluded to create a more favorable visual impression." [Misleading graph. Wikipedia]
The chart example "Scatter plot with missing categories" was created using the ConceptDraw PRO diagramming and vector drawing software extended with the Scatter Diagrams solution from the Graphs and Charts area of ConceptDraw Solution Park.
Scatter chart

Scatter Chart Examples

Use it to draw scatter graphs using ConceptDraw DIAGRAM diagramming and vector drawing software for illustrating your documents, presentations and websites.
Scatter Chart

Use this template to design your scatter charts.
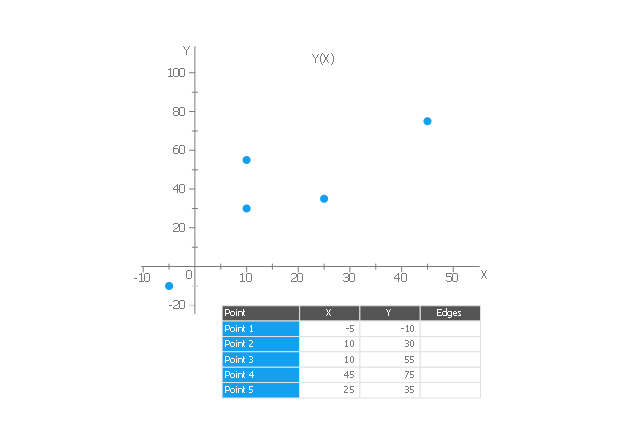
"A scatter plot, scatterplot, or scattergraph is a type of mathematical diagram using Cartesian coordinates to display values for two variables for a set of data.
The data is displayed as a collection of points, each having the value of one variable determining the position on the horizontal axis and the value of the other variable determining the position on the vertical axis. This kind of plot is also called a scatter chart, scattergram, scatter diagram, or scatter graph." [Scatter plot. Wikipedia]
The template "Scatter graph" for the ConceptDraw PRO diagramming and vector drawing software is included in the Scatter Diagrams solution from the Graphs and Charts area of ConceptDraw Solution Park.
Template
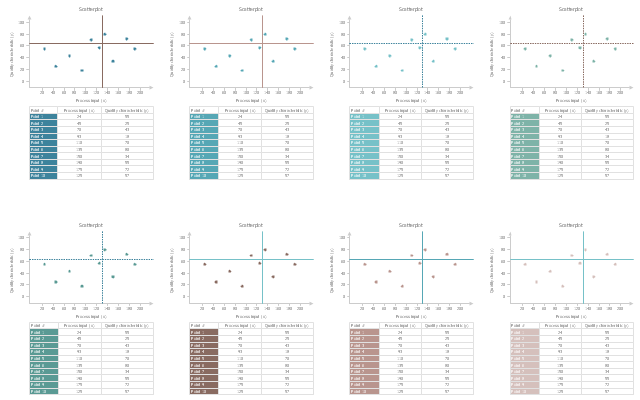
The vector stencils library "Scatterplot" contains 8 scatter diagram templates.
Use to design your scatter graphs with ConceptDraw PRO diagramming and vector drawing software.
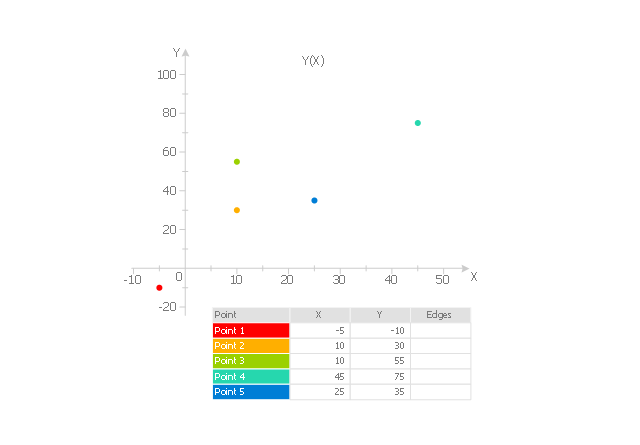
"A scatter plot, scatterplot, or scattergraph is a type of mathematical diagram using Cartesian coordinates to display values for typically two variables for a set of data. If the points are color-coded you can increase the number of displayed variables to three.
The data is displayed as a collection of points, each having the value of one variable determining the position on the horizontal axis and the value of the other variable determining the position on the vertical axis. This kind of plot is also called a scatter chart, scattergram, scatter diagram, or scatter graph. ...
The scatter diagram is one of the seven basic tools of quality control." [Scatter plot. Wikipedia]
The example of scatter chart templates "Design elements - Scatterplot" is included in the Seven Basic Tools of Quality solution from the Quality area of ConceptDraw Solution Park.
Use to design your scatter graphs with ConceptDraw PRO diagramming and vector drawing software.
"A scatter plot, scatterplot, or scattergraph is a type of mathematical diagram using Cartesian coordinates to display values for typically two variables for a set of data. If the points are color-coded you can increase the number of displayed variables to three.
The data is displayed as a collection of points, each having the value of one variable determining the position on the horizontal axis and the value of the other variable determining the position on the vertical axis. This kind of plot is also called a scatter chart, scattergram, scatter diagram, or scatter graph. ...
The scatter diagram is one of the seven basic tools of quality control." [Scatter plot. Wikipedia]
The example of scatter chart templates "Design elements - Scatterplot" is included in the Seven Basic Tools of Quality solution from the Quality area of ConceptDraw Solution Park.
Scatter graph templates
- Scatter Diagrams | Best Diagramming | Scatter Graph | Mind Map ...
- Scatter Graph Charting Software | Scatter Diagrams | How to Draw a ...
- Basic Diagramming | Line Graph | Bar Graph | Scatter Plot On Us ...
- Scatter Diagrams | Blank Scatter Plot | Scatter Chart Examples ...
- Baby height by age | Scatter Diagrams | Baby Age And Height ...
- Scatter Chart Examples | Scatter Diagrams | How to Draw a Scatter ...
- Scatter graphs - Vector stencils library
- Design elements - Scatter graphs | Scatter graphs - Vector stencils ...
- Scatter Plot | How to Draw a Scatter Diagram | Scatter Chart ...
- Scatter Graph Charting Software | Scatter Chart | Scatter Diagram ...
- Scatter Diagrams | Blank Scatter Plot | How to Draw a Scatter ...
- Scatter Graph Charting Software | Scatter Plot Graph | Scatter Chart ...
- Scatter Graph | Scatter graph - Template | Scatter graph - Template ...
- Scatter graphs - Vector stencils library | Picture graphs - Vector ...
- Scatter Graph Charting Software | Scatter Chart Examples | Scatter ...
- Scatter Plot | Design elements - Scatterplot | Blank Scatter Plot ...
- Blank Scatter Plot | Scatter Chart Examples | Scatter Plot | How To ...
- Design elements - Scatter graphs
- Normal distribution graph - Template | Double bar graph - Template ...
- Basic Diagramming | Scatter Graph | How To Create Restaurant ...
- ERD | Entity Relationship Diagrams, ERD Software for Mac and Win
- Flowchart | Basic Flowchart Symbols and Meaning
- Flowchart | Flowchart Design - Symbols, Shapes, Stencils and Icons
- Flowchart | Flow Chart Symbols
- Electrical | Electrical Drawing - Wiring and Circuits Schematics
- Flowchart | Common Flowchart Symbols
- Flowchart | Common Flowchart Symbols