Interior Design. Storage and Distribution — Design Elements

Lean Six Sigma Diagram Software

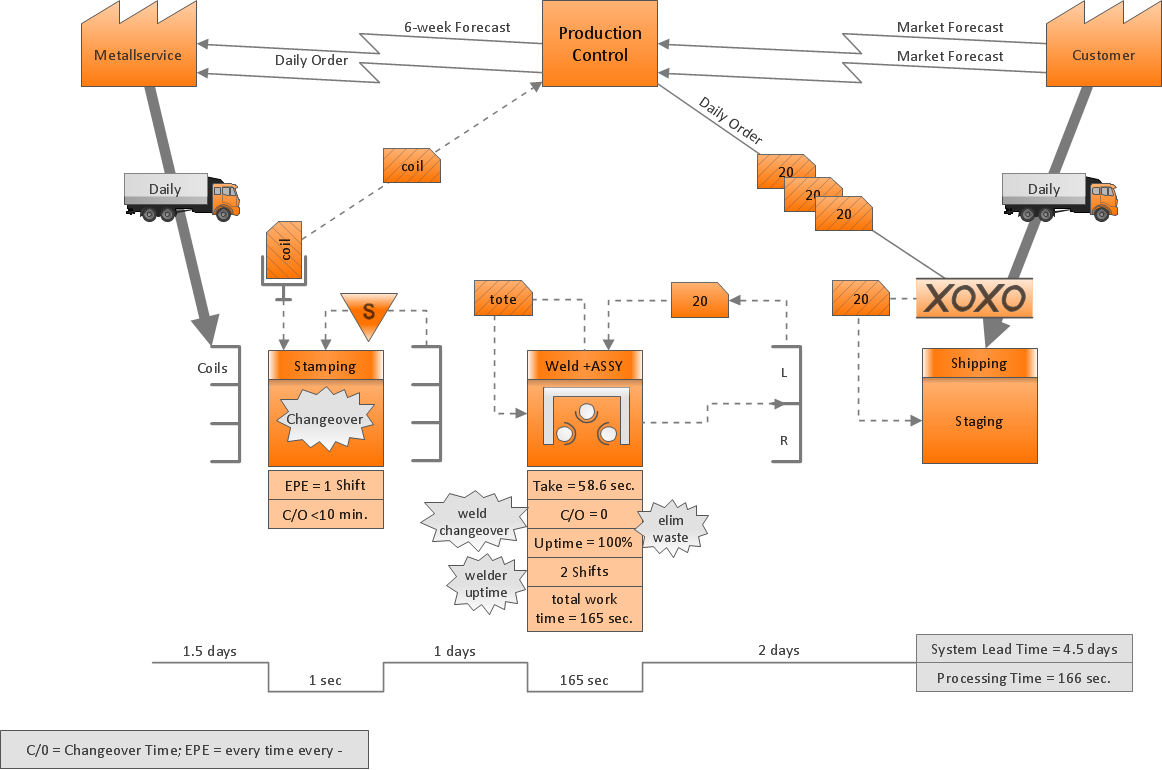
Value Stream Diagram

State Diagram Example — Online Store

This sample shows the work of the online store and can be used for the understanding of the online shopping processes, for projection and creating of the online store.
Lean Manufacturing Diagrams

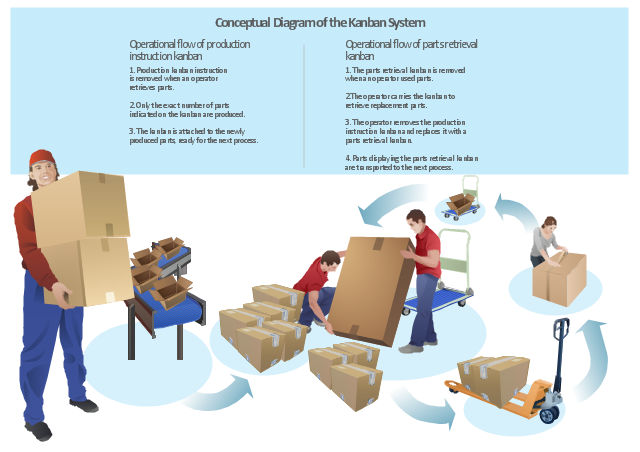
"Kanban ... (literally signboard or billboard) is a scheduling system for lean and just-in-time (JIT) production. Kanban is a system to control the logistical chain from a production point of view, and is not an inventory control system. Kanban was developed by Taiichi Ohno, at Toyota, to find a system to improve and maintain a high level of production. Kanban is one method through which JIT is achieved.
Kanban became an effective tool in support of running a production system as a whole, and it proved to be an excellent way for promoting improvement. Problem areas were highlighted by reducing the number of kanban in circulation." [Kanban. Wikipedia]
The example "Conceptual diagram of the Kanban System" was created in the ConceptDraw PRO diagramming and vector drawing software using the vector stencils library Packaging, loading, customs.
The example "Conceptual diagram of the Kanban System" is included in the Manufacturing and Maintenance solution from the Illustration area of ConceptDraw Solution Park.
Infographics
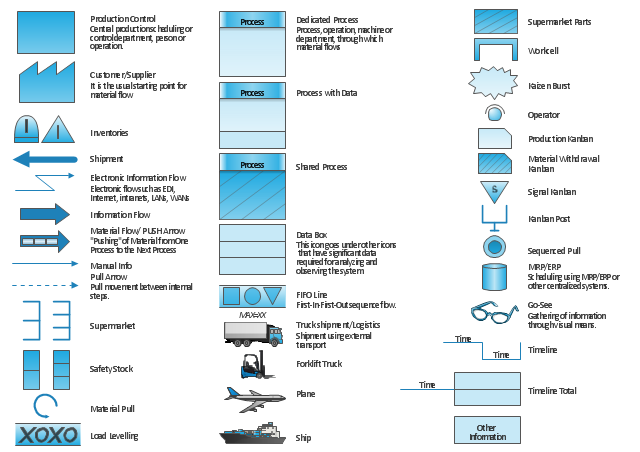
"Value stream mapping usually employs standard symbols to represent items and processes, therefore knowledge of these symbols is essential to correctly interpret the production system problems." [Value stream mapping. Wikipedia]
The vector stencils library Value stream mapping contains 43 symbols for drawing the value stream mapping diagrams using the ConceptDraw PRO diagramming and vector drawing software.
The example "Design elements - Value stream mapping diagram" is included in the Value Stream Mapping solution from the Quality area of ConceptDraw Solution Park.
VSM symbols
Cause and Effect Analysis

Design Element: Network Layout for Network Diagrams
.png)

Value Stream Mapping Presentations

Value Stream Mapping for the Lean Office

Learn how to create a current state value stream map

Best Value Stream Mapping mac Software

Value Stream Management
- Conceptual diagram of the Kanban System | Toyota Forklift
- Forklift Diagram
- Design Element: Rack Diagram for Network Diagrams | UML ...
- Design Element: Rack Diagram for Network Diagrams | Emergency ...
- Diagram Of A Tractor Tank
- Industrial transport - Vector stencils library | A Well Label Diagram Of ...
- Diagram Of A Roller Road Construction
- Design elements - Industrial vehicles | Diagram Of Tractor Attached ...
- Warehouse layout floor plan | Design Element: Rack Diagram for ...
- Hydraullic Crane Simple Diagram
- Industrial transport - Vector stencils library | Diagram Of A Tractor ...
- Technical Drawing Forklift
- Label Diagram Of Dumper
- Server rack diagram | Storage and distribution - Vector stencils ...
- Full Label Diagram Of Road Roller
- Label Diagram Of Bulldozer
- Design Element: Rack Diagram for Network Diagrams | Interior ...
- Construction Roller Diagram
- Storage and distribution - Vector stencils library | Design Element ...
- Labelled Diagram Of Tractor
- ERD | Entity Relationship Diagrams, ERD Software for Mac and Win
- Flowchart | Basic Flowchart Symbols and Meaning
- Flowchart | Flowchart Design - Symbols, Shapes, Stencils and Icons
- Flowchart | Flow Chart Symbols
- Electrical | Electrical Drawing - Wiring and Circuits Schematics
- Flowchart | Common Flowchart Symbols
- Flowchart | Common Flowchart Symbols