Data Flow Diagram (DFD)

Control and Information Architecture Diagrams (CIAD) with ConceptDraw DIAGRAM

Data Flow Diagram Software

ConceptDraw DIAGRAM is a powerful Data Flow Diagram Software thanks to the Data Flow Diagrams solution from the Software Development area of ConceptDraw Solution Park.
You can use the predesigned DFD vector objects that are grouped in 3 libraries of Data Flow Diagrams solution: Data Flow Diagrams Library; Gane-Sarson Notation Library; Yourdon and Coad Notation Library.
Structured Systems Analysis and Design Method (SSADM) with ConceptDraw DIAGRAM

Information Architecture
Example of DFD for Online Store (Data Flow Diagram)

Example of DFD for Online Store shows the Data Flow Diagram for online store and interactions between the Visitors, Customers and Sellers, as well as Website Information and User databases.

 IDEF0 Diagrams
IDEF0 Diagrams visualize system models using the Integration Definition for Function Modeling (IDEF) methodology. Use them for analysis, development and integration of information and software systems, and business process modelling.
 Data Flow Diagrams (DFD)
Data Flow Diagrams solution extends ConceptDraw DIAGRAM software with templates, samples and libraries of vector stencils for drawing the data flow diagrams (DFD).
Data Flow Diagram

IDEF9 Standard

What Is Information Architecture
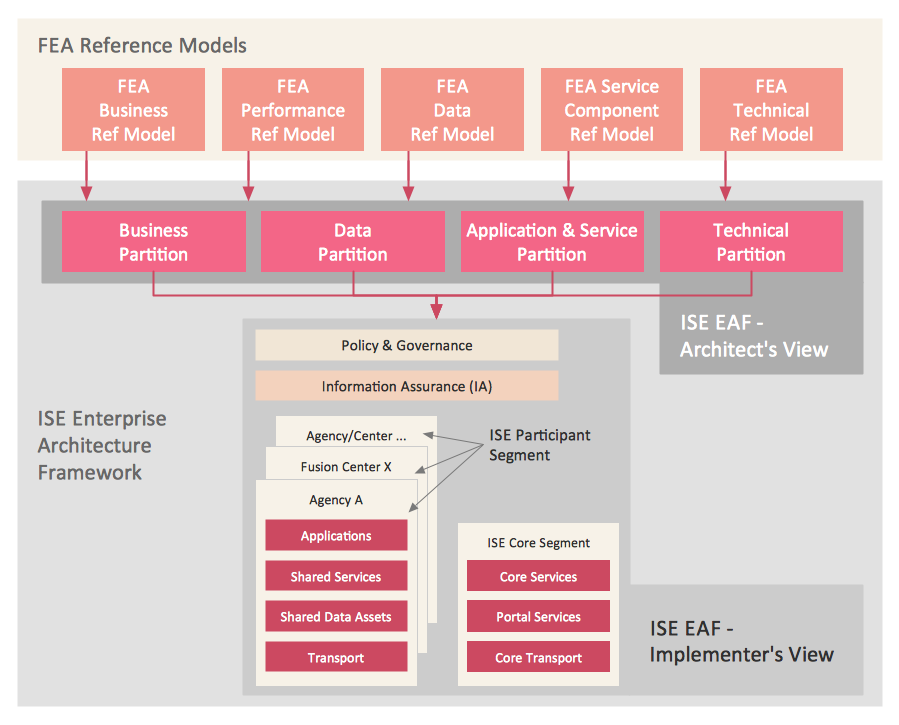
ConceptDraw DIAGRAM extended with Enterprise Architecture Diagrams Solution from the Management Area is the best software for design information architecture and drawing Enterprise Architecture Diagrams.
Venn Diagram Examples for Problem Solving. Computer Science. Chomsky Hierarchy

The Venn diagram example below visualizes the the class of language inclusions described by the Chomsky hierarchy.
UML Use Case Diagram Example. Social Networking Sites Project

This sample shows the Facebook Socio-health system and is used at the projection and creating of the social networking sites.
Gane Sarson Diagram

- Difference Between Architecture Context Diagram And Architecture
- Architectural Context Diagram Example
- Example For Architectural Context Diagram
- Context Diagram Template | Venn Diagram Examples for Problem ...
- Context Diagram Sample Billing
- Difference Between Dfd And Context Diagram
- Difference Between Data Flow Diagram And Architecture Diagram
- Example of DFD for Online Store ( Data Flow Diagram ) DFD ...
- Context Diagram Template | Top-level context diagram | DFD Library ...
- Example of DFD for Online Store ( Data Flow Diagram ) DFD ...
- Example of DFD for Online Store ( Data Flow Diagram ) DFD ...
- Cafe Context Diagram
- Sales Flowcharts | Floor Plans | Data Flow Diagram Software ...
- Information System Architecture Diagram
- Data Flow Diagram With Easy Business Example
- Control and Information Architecture Diagrams (CIAD) with ...
- Data Flow Diagram (DFD) | Context Diagram Template | Process ...
- Enterprise Architecture Diagrams | Fishbone Diagrams | Using ...
- Data Flow Diagrams (DFD)
- Context Diagram Template | Structured Systems Analysis and ...
- ERD | Entity Relationship Diagrams, ERD Software for Mac and Win
- Flowchart | Basic Flowchart Symbols and Meaning
- Flowchart | Flowchart Design - Symbols, Shapes, Stencils and Icons
- Flowchart | Flow Chart Symbols
- Electrical | Electrical Drawing - Wiring and Circuits Schematics
- Flowchart | Common Flowchart Symbols
- Flowchart | Common Flowchart Symbols