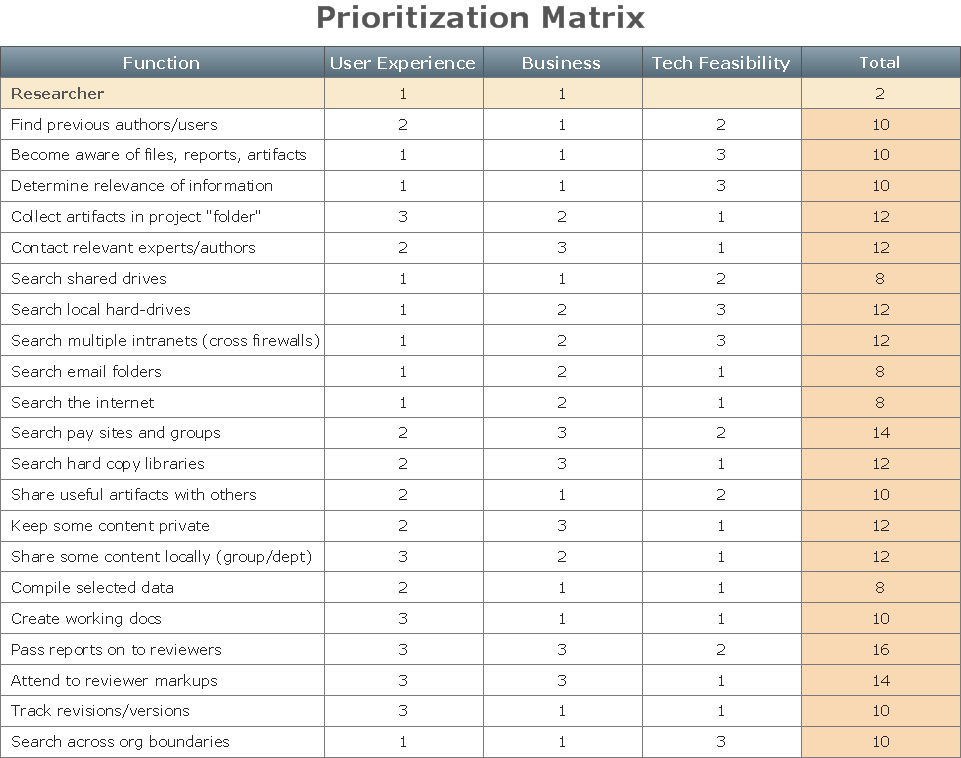
Prioritization Matrix
You can design the Prioritization Matrix by hand on the paper, but we offer you the most easier way - to use the ConceptDraw PRO diagramming and vector drawing software extended with Seven Management and Planning Tools Solution from the Management Area.Corrective Action Planning
One of the stages of the problem's solving process scenario is Corrective Action Planning. Corrective action planning define people and groups involvement in corrective actions by roles, identify logical sequences of scheduled actions and critical path of problem solving, identify possible risks of action plan and propose preventive actions.
Activity Network (PERT) Chart
Activity Network and Project Evaluation and Review Technique, or PERT, charts are a way of documenting and analyzing the tasks in a project. This diagram is constructed as part of the process in creating a schedule of corrective actions. The Activity Network Chart (PERT) shows the logical connections and consequence of tasks to be performed. It displays the time period for problem solving and the implementation of all activities through the critical path.Flow Chart Design - How to Design a Good Flowchart
Use ConceptDraw PRO business diagramming and business graphics software for general diagramming purposes, it inludes tousands colored professional flowchart symbols, examples and samples which saves time when you prepare documents, professional presentations or make an explanation of process flow diagram.Create a Cross-Functional Flowchart
Fast creating visualization for structured data is the main capability of ConceptDraw PRO software. With numerous vector stencils from object libraries and the RapidDraw technology this software becomes the best cross-functional flowchart software.Software Flow Chart
Many professionals have to solve problems every day. Designing of the process algorithm contribute to understand where the problem is in the process. A Flowchart is a graphical tool that most usable for breaking down processes. Definition of flowchart - a diagram that shows step-by-step progression through a procedure or system especially using connecting lines and a set of conventional symbols. All the icons, symbols and connectors needed for creating standardized notation flowcharts are contained within Software Flow Chart.CORRECTIVE ACTIONS PLANNING. PERT Chart
The PERT Chart is constructed as part of the process in creating a schedule of corrective actions. The PERT Chart shows the logical connections and consequence of tasks to be performed. It displays the time period for problem solving and the implementation of all activities through the critical path. ConceptDraw Office suite is a software for corrective actions planning.
Managing the task list
Four lessons explaining how to manage your task list in a Gantt chart. You will learn how to adjust your Gantt chart view, how to add/delete tasks or subtasks, how to change tasks hierarchy, how to show/hide subtasks.Project — Working With Tasks
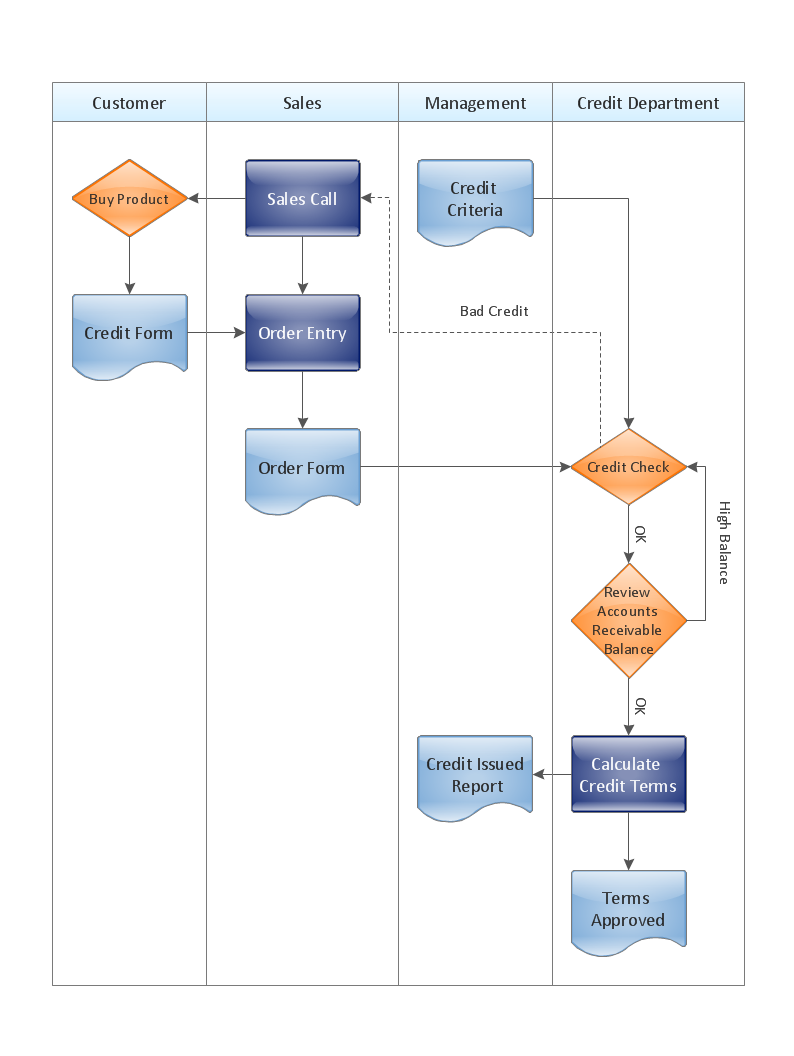
A full-featured project management solution with all the necessary functions right at your fingertips. Generates an extensive variety of reports on project and task statuses. These videos provide a series of lessons that will enhance the understanding of all our users, from people just starting out with the software, through to expert users.Credit Card Order Process Flowchart. Flowchart Examples
This sample was created in ConceptDraw PRO diagramming and vector drawing software using the Flowcharts solution from the What is a Diagram area of ConceptDraw Solution Park. This sample shows the Flowchart of the Credit Card Order Process. On this diagram are used the flowchart symbols that represents the processes and documents. The flowchart symbols are connected with arrows.Flowchart Marketing Process. Flowchart Examples
This sample shows the Flowchart that displays the layout and work flow of the cloud marketing platform. This diagram has a style of the marketing brochure. This style displays the central product that is related to the other issues. Using the ready-to-use predesigned objects, samples and templates from the Flowcharts Solution for ConceptDraw PRO you can create your own professional looking Flowchart Diagrams quick and easy.Affinity Diagram
The affinity diagram is a business tool used to organize ideas and data. It is one of the Seven Management and Planning Tools. But how design the Affinity Diagram quick and easy? ConceptDraw PRO diagramming and vector drawing software offers the Seven Management and Planning Tools Solution from the Management Area.Business Process Elements: Activities
Create professional business process diagrams using ConceptDraw Activities library with 34 objects from BPMN.
Samples of Flowchart
This sample shows the Flowchart of the testing the work of the lamp and decision making about what to do to lamp will work."As a discipline, task management embraces several key activities. Various conceptual breakdowns exist, and these, at a high-level, always include creative, functional, project, performance and service activities.
Creative activities pertain to task creation. In context, these should allow for task planning, brainstorming, creation, elaboration, clarification, organization, reduction, targeting and preliminary prioritization.
Functional activities pertain to personnel, sales, quality or other management areas, for the ultimate purpose of ensuring production of final goods and services for delivery to customers. In context these should allow for planning, reporting, tracking, prioritizing, configuring, delegating, and managing of tasks.
Project activities pertain to planning and time and costs reporting. These can encompass multiple functional activities but are always greater and more purposeful than the sum of its parts. In context project activities should allow for project task breakdown, task allocation, inventory across projects, and concurrent access to task databases.
Service activities pertain to client and internal company services provision, including customer relationship management and knowledge management. In context these should allow for file attachment and links to tasks, document management, access rights management, inventory of client & employee records, orders & calls management, and annotating tasks.
Performance activities pertain to tracking performance and fulfillment of assigned tasks. In context these should allow for tracking by time, cost control, stakeholders and priority; charts, exportable reports, status updates, deadline adjustments, and activity logging.
Report activities pertain to the presentation of information regarding the other five activities listed, including graphical display." [Task management. Wikipedia]
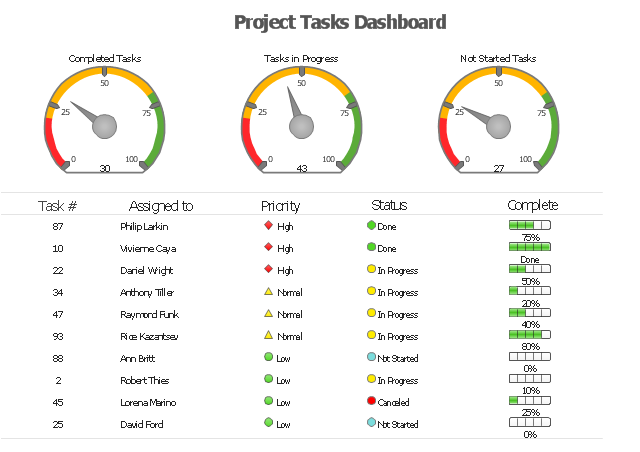
The example "Project tasks dashboard" was created using the ConceptDraw PRO diagramming and vector drawing software extended with the Status Dashboard solution from the area "What is a Dashboard" of ConceptDraw Solution Park.
- PROBLEM ANALYSIS. Prioritization Matrix | Project tasks dashboard ...
- Matrix Organization Structure | How to Draw a Matrix Organizational ...
- Prioritization matrix - Template | How To Create a Prioritization ...
- Prioritization Matrix | How To Create a Prioritization Matrix ...
- Project — Task Trees and Dependencies | Project — Working With ...
- Management Activities
- PROBLEM ANALYSIS. Prioritization Matrix | Pyramid Diagram ...
- Matrix Diagram Between Prioritization Diagram
- Project — Task Trees and Dependencies | How to Draw an ...
- Prioritize Business Opportunities Mind Map
- How To Create a Prioritization Matrix | Prioritization Matrix ...
- Competitive feature comparison matrix chart - Digital scouting ...
- Value Stream & Process Flow Diagramming Software | Prioritization ...
- Matrix Flow Chart
- Prioritization matrix - Health care problems | Seven Management ...
- How to Draw a Matrix Organizational Chart with ConceptDraw PRO
- Project management task status dashboard | Project — Task Trees ...
- SWOT matrix template | How to Draw a Good Diagram of a Business ...
- Flow chart Example. Warehouse Flowchart | Event-driven Process ...


