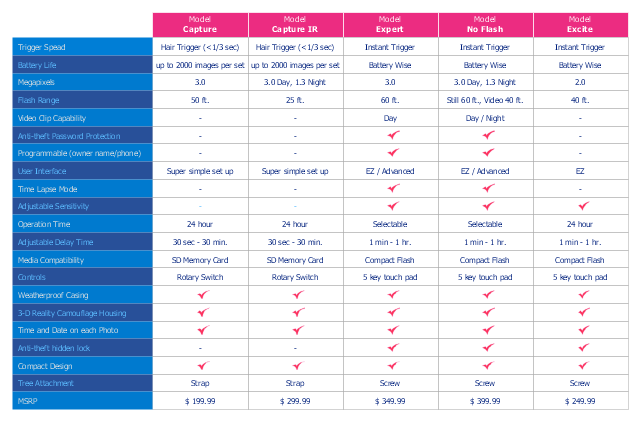
Competitive Feature Comparison Matrix is a tool to compare the features and functionality of competitive products or services in side-by-side table.
The feature comparison matrices are used for feature comparison analysis of competitive products and services.
This competitive feature comparison matrix chart example was created using the ConceptDraw PRO diagramming and vector drawing software extended with the Matrices solution from the Marketing area of ConceptDraw Solution Park.
Feature comparison chart
Relative Value Chart Software

HelpDesk
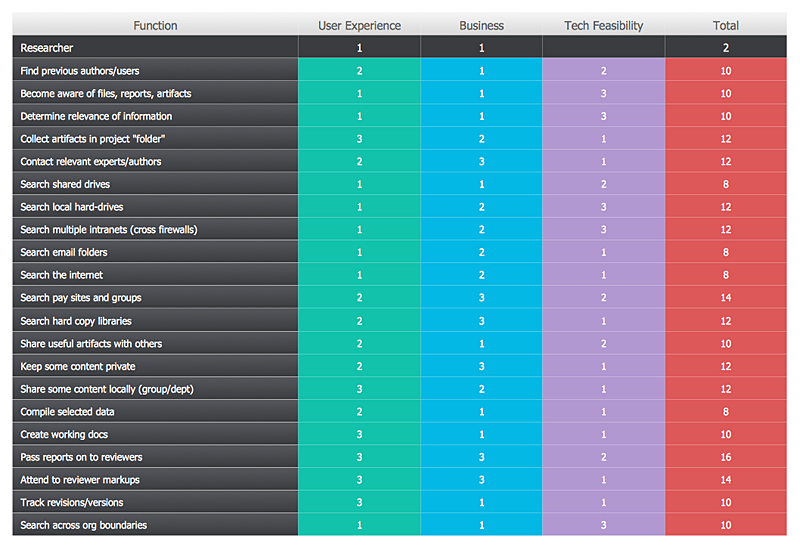
How To Create a Prioritization Matrix
 Comparison Dashboard
Comparison dashboard solution extends ConceptDraw DIAGRAM software with samples, templates and vector stencils library with charts and indicators for drawing the visual dashboard comparing data.
SWOT Sample in Computers

 Divided Bar Diagrams
The Divided Bar Diagrams Solution extends the capabilities of ConceptDraw DIAGRAM with templates, samples, and a library of vector stencils for drawing high impact and professional Divided Bar Diagrams and Graphs, Bar Diagram Math, and Stacked Graph.
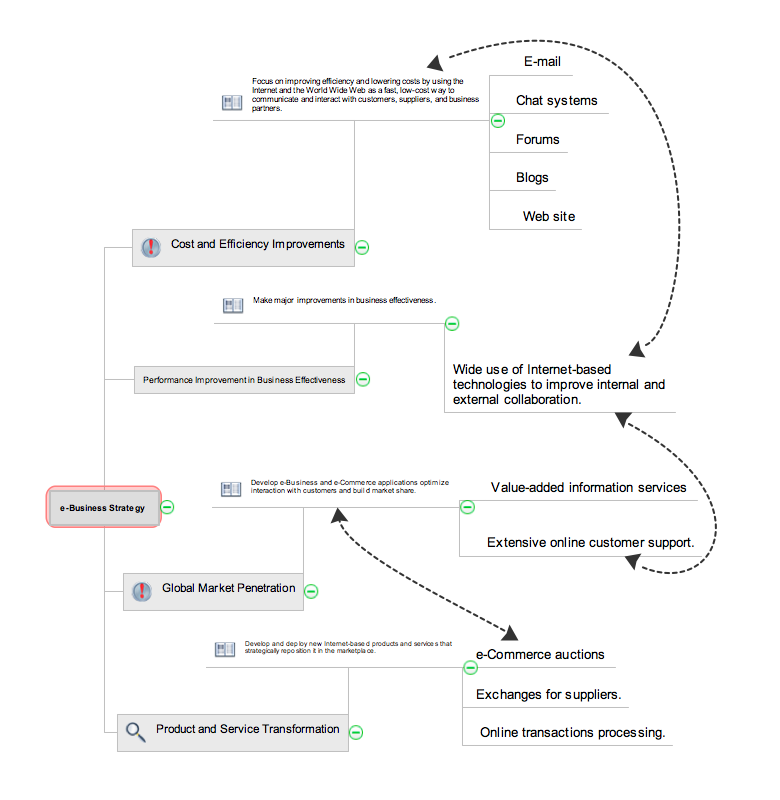
Successful Strategic Plan

How to show a mind map presentation via Skype
- Competitive feature comparison matrix chart - Digital scouting ...
- Competitive feature comparison matrix chart
- Competitive feature comparison matrix chart - Digital scouting cameras
- Bar Chart Template for Word | SWOT analysis matrix diagram ...
- Feature Comparison Chart Software | Financial Comparison Chart ...
- Feature Comparison Chart Software | SWOT analysis matrix ...
- Example Of Comparative Matrix Easy
- Feature Comparison Chart Software | Competitive feature ...
- Feature Comparison Chart Software | Bar Chart Template for Word ...
- Financial Comparison Chart | Feature Comparison Chart Software ...
- Marketing | Matrices | SWOT analysis matrix diagram templates ...
- Matrices | Marketing | Competitive feature comparison matrix chart ...
- Feature Comparison Chart Software | Bar Chart Template for Word ...
- Feature Comparison Chart Software | SWOT analysis matrix ...
- Competitor Analysis | SWOT analysis matrix diagram templates ...
- Feature Comparison Chart Software | Business Productivity ...
- Comparison Dashboard | Financial Comparison Chart | SWOT ...
- Competitor Analysis | Competitive feature comparison matrix chart ...
- Marketing | SWOT analysis matrix diagram templates | Fishbone ...